


In the history of web performance, “Load Time” was one of the first indicators used to measure the loading times of web pages. Over time, the other KPIs we’ve talked about—Speed Index, Time To Interactive, etc.—made their way onto the scene to assess the perception of speed and Load Time was retired to a dusty old shelf at the back of a storeroom. Let’s look back on this web performance metric that once played an important role, but which is no longer sufficient for assessing the speed of your website, and we’ll see why.
What is Load Time?
In theory, Load Time is a web performance metric that tells you the time needed for a web page to fully load. In this way, it differs from the Speed Index, which is used to measure the time it takes to load page elements above the fold.
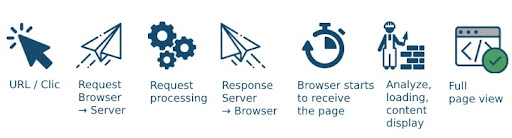
The duration of loading expressed by the Load Time starts from the moment when the internet user sends their request and it ends when all page elements have loaded, JavaScripts have been executed, CSS files have been analysed, and non-lazy-loaded images have been rendered. Between those beginning and end points, here’s what happens:
- The internet user enters a URL or clicks on a link
- The browser sends a request to the server
- The server processes the request
- The server sends a response to the browser
- The browser begins receiving the page (this event is marked by the TTFB)
- The browser analyses, loads, and displays the content
- And finally… the entire page is available and the loading wheel stops spinning.
What happens when the page has finished loading? The JS Load event of the “window” object is triggered.
In the introduction, we defined Load Time “in theory,” and now you’ll better understand why we say that. As we’ve just seen, generally, when the “onload” event is triggered, the cookies banner appears, advertising and tracking elements are activated, multimedia content is launched, etc.
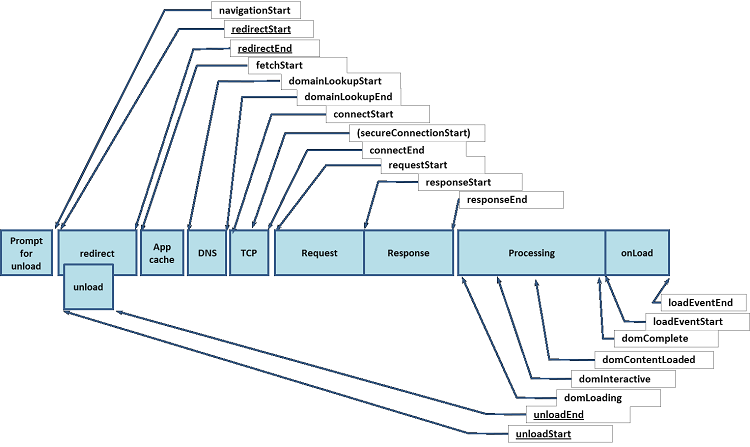
This is what makes it a “theoretical” evaluation of the full loading time, because, as we’ve just seen, when the “onload” event is triggered (and we’ll discuss this further later when we talk about the “waterfall”), the page has not really finished fully loading.
Why was Load Time important and why is that no longer the case?
Starting in 2010, APIs came into play, enabling the collection of data on loading times in browsers (“performance timing” evolved towards “navigation timing” starting in 2012). Over time, metrics began to focus on the perception of speed to better represent the user experience.
For a better user experience, you can optimize your frontend. By doing so, on the one hand, you can lighten your pages so that they load faster and, on the other hand, you can prioritise the order of appearance of your content or the way in which it loads to improve the perception of speed.
For example, you can tell the browser how to load JavaScript and images, cache static elements to make them display faster, etc.
You can also defer JavaScript loading, and in so doing increase your Load Time, but the page’s content (other than Javascript content) will be able to display earlier and thus improve the perception of speed.
In absolute terms, the faster relevant content is available to your users, the stronger their engagement will be. This is one of the reasons why what happens above the fold is crucial.
Why? Because what counts in terms of user experience is the speed at which the relevant elements become visible (and better yet: clickable!) in the viewport, and that’s exactly what the Speed Index, First Contentful Paint, and Core Web Vitals allow you to measure, much better than Load Time.
So, only taking into account the time it takes to fully load a page isn’t very useful and isn’t a relevant basis for improving your user experience.
That said … how do you measure loading time?
WebPageTest allows you to measure the loading time, which is expressed in seconds. This metric is found at the top of the WebPageTest waterfall” and is represented in it by a dark blue line that indicates the full loading of the page (“document complete”).
Like most web performance KPIs, loading times depends on your server and the bandwidth you have, the design of your page, its weight, the way it’s structured, etc. However, it also depends on where the internet user is located, their equipment, their browser, the number of third parties and their response times, etc.
Load Time: where do you stand?
According to HTTP Archive, which assesses the state of the web, the average “onload” in 2020 was 18.5 seconds for mobile devices and 7 seconds for computers. This difference can, of course, be explained by the fact that mobile device processors are less powerful and network quality is not always up to snuff.
This difference between mobile devices and computers is even greater than for other indicators because it involves loading not only elements above the fold, but also everything else on the page. As such, you may have a lot of work to do if your pages have a lot of content and third-party scripts.
In spite of it all, even though this metric is not the most important for evaluating the speed of your website—and it should not, under any circumstances, be the only one used, for all of the reasons we’ve mentioned—let’s look at how to improve it.
How can you improve your Load Time?
For your pages to load faster, here are a few essential tips that you can apply:
- compress your HTML files, images, JavaScript, etc., to reduce their size; minify or, if applicable, split your CSS and JavaScript files;
- limit third parties, as each piece of content that must be retrieved from a third party requires more time for your browser to seek and display the data;
- use a CDN to bring content closer to your users;
- decrease the number of requests or pre-load the most critical requests;
- warm up your cache.
Relieve your tech teams,
automate the application of these web performance optimizations!
Measure the effects of our solution on the speed of your pages: