


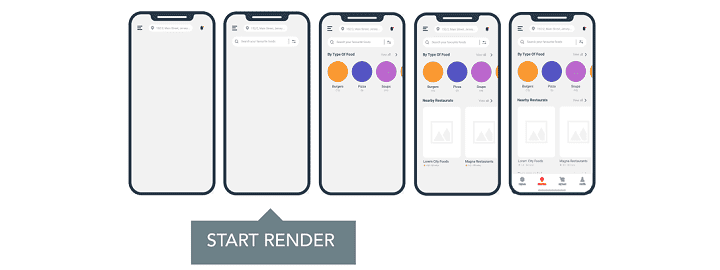
Start Render marks the moment when a web page displays the first asset, whatever its size or relevance to the user. It is directly linked to perceived speed.
Why is Start Render an important indicator?
Loading time is the user’s main requirement in terms of UX and the fast appearance of the first assets contributes to the perception of the website’s speed.
In addition, a good Start Render allows you to minimise the bounce rate. As soon as assets are visible on a page, users are less tempted to leave it, and you reduce the risk of them abandoning their visit or their basket.
It is therefore in your interests to have a good Start Render, because if the first assets display quickly, this sends a reassuring message to your users that: “the website works”.
It is also the first metric linked to the UX during browsing. It marks the start of display and reports on the beginning of the user experience. This is how it is distinguishable from two other web performance metrics that are also linked to the UX:
- the Speed Index reports loading of all the visible assets above the float line;
- the Time To Interactive (TTI), which measures interactivity.
Having said this, you can have a very good Start Render and a very bad user experience: for example, a hamburger menu displays, then nothing else happens for the next 10 seconds.
We will also see how this metric is similar to the First Contentful Paint (FCP) that counts towards Google’s Lighthouse and PageSpeed scores.
How is the Start Render measured?
It is a visual metric that can be deduced by noting the moment when the first assets appear. It is available notably on WebPageTest.
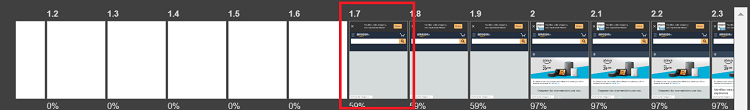
But be careful! The filmstrip frames change every x ms, and for WebPageTest the most precise interval on offer is 100 ms. What is visible does not therefore indicate the exact moment at which the blank page shows the very first asset, which generally displays in this interval. In the above filmstrip, the very first element may have appeared between 1.6 s and 1.7 s but the Start Render is defined at 1.7 s.
To be as realistic as is possible, an equivalent indicator is on offer on certain browsers: the First Contentful Paint (FCP).
What is the difference between Start Render and FCP?
Do you use Google tools such as Lighthouse or PageSpeed Insights to measure your web performance? If you do, you may have come across FCP already.
Anecdotally, Google used Speed Index until 2017 to evaluate the speed of web pages. When it developed its Chrome User Experience Report (CrUX), Google then had to turn to a standardised metric and used FCP.
But why did it stop using Speed Index? Quite simply because Speed Index provides an estimate based on observation of the page load (mainly using tools such as Synthetic Monitoring), whereas FCP uses the browser’s APIs.
This indicator takes account of the very first asset defined in the DOM (text, image, background, etc., including the SVG or the <canvas>) which is rendered (in the technical sense of the word, not in the sense of display) by the browser, anywhere on the page. FCP thus excludes everything that would be contained in iframes.
Note that FCP can be triggered from assets that are not visible to the user, for example text whose font has not yet loaded or assets under the float line. Hence the advantage of Start Render for moving as close as possible to the user’s perception.
How should you position yourself?
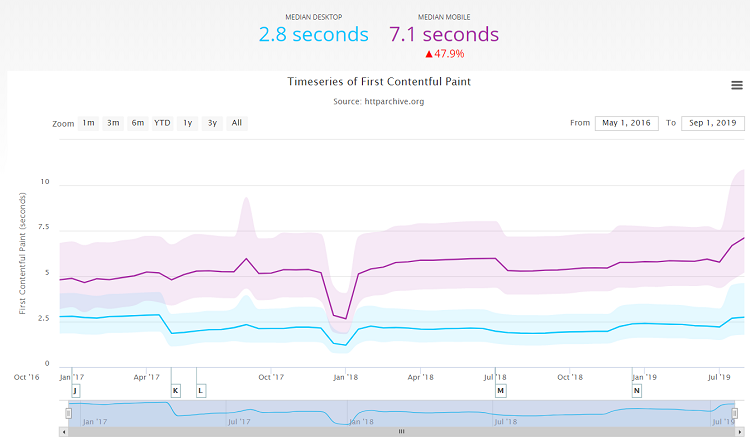
According to HTTParchive which evaluates the state of the web in terms of performance, the First Contentful Paint median in 2019 was 2.8 seconds on desktops and 7.1 seconds on mobiles.
And what about the most frequently visited websites in France? We collected data for September 2019 for mobile websites in 4G and established a Start Render average of websites at the top of the mobile web performance ranking that we create each month with the Journal du Net.
The lowest Start Render among websites at the top of the general ranking was 785 (Twitter). Wikipedia and Service-public.fr, which are regularly top of the rankings, record an average Start Render of 2461 and 1271 respectively.
Rue Du Commerce, which is frequently in 1st place in the e-commerce rankings, had an average Start Render of 2661. Amazon has 1938 and Leroy-Merlin (furnitures and tooling) 2998.
As far as the media is concerned, the websites in the lead group for French medias were franceinfo: (1371), YouTube (909), Le Monde (2216) and Ouest-France (2569).
Lastly, in the French travel sector, Hotels.com had an average Start Render of 2977, Air France 2958 and Expedia 1869.
The mobile web performance ranking was then based on the Webperf Score, so it was possible to have an excellent Start Render without being at the top of the ranking if the rest of the page took a long time to load, or if the delay before interacting was long. Conversely, the Start Render could be a bit higher, but with a very short full page display and/or the interactivity available quickly.
(NB: the Web Performance Score consisted of an average of the Speed Index and the TTI, a method used until 2021 to produce the ranking in partnership with JDN. Since 2021, the monthly mobile web performance ranking is based on Core Web Vitals)
How can you improve your Start Render?
Here are a few key points to help optimise your Start Render:
- Set up a cache server. The shorter the response time, the better your chances of lowering your Start Render.
- Remember to inline the CSS that are necessary for displaying elements located above the float line. This is a potentially blocking resource that you need to make available as quickly as possible. Load the remainder asynchronously and, above all, limit the number of CSS files.
- If your page contains JavaScript, load it asynchronously. If it blocks, it will penalise your Start Render.
- If your website is international, a CDN may help reduce your load times.
How we can help you
improve your Start Render and First Contentful Paint, and your web performance in general ?
Our clients can tell you about the technical benefits they have reaped thanks to our SaaS solution: