


To assess your loading times and improve them, you need to precisely identify your tasks and events that take up the most time for browsers. But how do you know how long it takes a script to execute? Or when the main image on a page displays? What is the processing time for a user action before it executes?
To answer all of these questions, the conventional tools and metrics may only provide limited responses. The answers can be found with custom metrics via the User Timing API.
Jean-Pierre Vincent explains how to use it.
Measure the events of your choice during page loading
There is many web performance indicators and each one has its own utility. Among the best known, you can observe the loading speed above the fold with the Speed Index, the interactivity with the Time To Interactive or First Input Delay / Total Blocking Time, the moment when the white page gives way to the first elements with the Start Render or First Contentful Paint, or evaluate the server response time with the Time To First Byte, and measure the quality of your user experience with Google Core Web Vitals as well …
However, for more granular detail and to detect certain specific areas for improvement (of your UX, your conversion rates, etc.), certain events during page loading are worth isolating to be measured. Indeed, content is not all created equal and not all content has the same importance for your users.
So, what’s the solution? The User Timing API allows you to mark JavaScript events so that your RUM or synthetic monitoring tool will display them just like the classic page loading events.
In this way, you can indicate custom events wherever you wish to detect the moment when an image or a slider displays, when an A/B test script launches, when a call to action becomes active, or when the DeferJS begins to execute, etc.
This method is particularly useful for pages based on components as it can tell you when the execution of a component is finished.
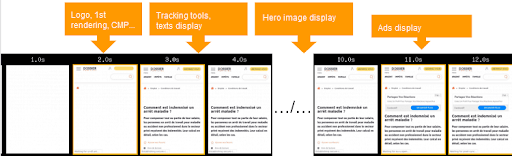
Here is a case in which custom metrics are especially useful: for a news website. For this type of website, page loading includes numerous events for which generic metrics don’t work as well.
In this example, which is typical of page loading for a media website, without custom metrics, it’s impossible to know if the Speed Index or Start Render actually fits with the real business needs. Indeed, the Médiamétrie counter (which the web user doesn’t see but is vital for the media business) and advertisements interfere with the work of the monitoring tools, especially for analyses based on the Speed Index. Because of these events, you can’t deduce the real loading time for elements that are relevant for the user.
Why should you use custom metrics and how do you implement them?
Implementing custom metrics requires modifying the source code and some basic maintenance, but it’s worth the trouble because they give you personalised indicators to fit exactly what you need to measure.
The User Timing API
Available for practically every browser since Chrome 25, this API is used to measure performance by giving access to precise, customisable time markers.
To mark the start of an event
You will need to use the standard performance.mark() to ask the browser to mark the events of interest to you by assigning them a name, whose entryType will be “mark” (which can then be retrieved via window.performance.getEntries()), and the duration attribute will be set to 0 (Note: For third parties, you will have to ask the third-party provider to implement the HTTP header Timing-Allow-Origin):
[pastacode lang=”markup” manual=”performance.mark(‘my-metric’)%3B” message=”” highlight=”” provider=”manual”/]
To measure a duration between two events
You can also measure the duration between two marks as follows. The entryType will be “measure” and the duration attribute will correspond to the difference between the start and end marks:
[pastacode lang=”markup” manual=”performance.mark(%E2%80%98startSlider%E2%80%99)%3B%0A%0Aperformance.mark(%E2%80%98endSlider%E2%80%99)%3B%0A%0Aperformance.measure(%E2%80%98loading-slider%E2%80%99%2C%20%E2%80%98startSlider%E2%80%99%2C%20%E2%80%98endSlider%E2%80%99)%3B” message=”” highlight=”” provider=”manual”/]
To observe changes on the screen
As Boris Schapira stresses in a detailed article on this subject: just because the browser executes some JavaScript doesn’t mean the user will be able to see the changes on the screen.
The solution in this case is to use requestAnimationFrame(). With this solution, the marker is incorporated to show you the behaviour of the interface rather than the code’s execution.
A bit later, we will look at the Element Timing API, which also responds to this need.
Some use cases
We’ve mentioned how there are numerous web performance metrics… and the possibilities become endless with custom metrics.
To inspire you, here are a few use cases suggested by SpeedCurve:
- detect when CSS loading is complete and understand when rendering begins;
- observe when blocking scripts have finished loading and executing;
- identify the start of loading for fonts;
- see when the most important image (“hero image”) or text appears;
- mark actions in a single-page app.
If you’re now convinced of the usefulness of custom metrics, you may be wondering how to view them. Here’s how to integrate these data into your web performance monitoring tools.
Visualize custom metrics data
In a synthetic monitoring tool
To view these custom metrics in a monitoring tool, you will have to declare them. There are several methods for integrating them into your monitoring tools: in a JavaScript block (as we’ve seen), a JavaScript script, or in HTML with this type of tag:
[pastacode lang=”markup” manual=”%3Cimg%20src%3D%22hero.jpg%22%20onload%3D%22performance.mark(‘hero%20image’)%3B%22%3E” message=”” highlight=”” provider=”manual”/]
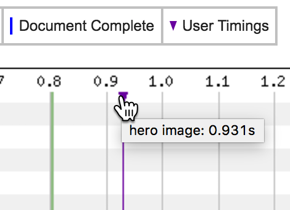
WebPageTest and Dareboost can then collect and visually translate the metrics.
For example, in WebPageTest:
Or in Dareboost :
In a real-user monitoring (RUM) tool
Viewing the selected events in a RUM tool requires that you send the data to the tool. It’s a bit more complex than for a synthetic monitoring tool.
To do this, your best option is a RUM tool that offers a good sampling rate, like Quanta, New Relic, and Pingdom.
If you are interested in an open-source option: BoomerangJS will allow you to collect the data on the browser side; BasicRUM, deployed on your own servers, is useful for storing and viewing the data.
You can also use Google Analytics, which has the advantage of being free, but… you should note that its sampling is not ideal, and although it can be augmented by following these instructions, it will only allow you to produce an estimate, not to get precise results.
Still, let’s look at how you can use Google Analytics to mark and display customised items thanks to user timings.
This operation requires two steps:
- Collect the timing of a given event from the browser’s timeline after the page has finished loading:
[pastacode lang=”javascript” manual=”window.addEventListener(‘load’%2C%20()%20%3D%3E%20%7B%0A%0Aperformance.getEntriesByType(‘mark’).forEach(%20(t)%20%3D%3E%20console.log(%20t.name%2C%20t.startTime%20)%20)%0A%0A%7D)%C2%A0″ message=”” highlight=”” provider=”manual”/]
Example output:
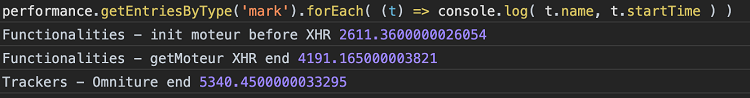
- Send this figure to the server, in this case of Google Analytics.
Then you just replace the console.log() above with the following line (to be adapted according to the instructions from your RUM provider):
[pastacode lang=”javascript” manual=”ga(‘send’%2C%20%7B%0A%0A%C2%A0%C2%A0hitType%3A%20’timing’%2C%0A%0A%C2%A0%C2%A0timingCategory%3A%20t.name%2C%0A%0A%C2%A0%C2%A0timingValue%3A%20t.startTime%0A%0A%7D)” message=”” highlight=”” provider=”manual”/]
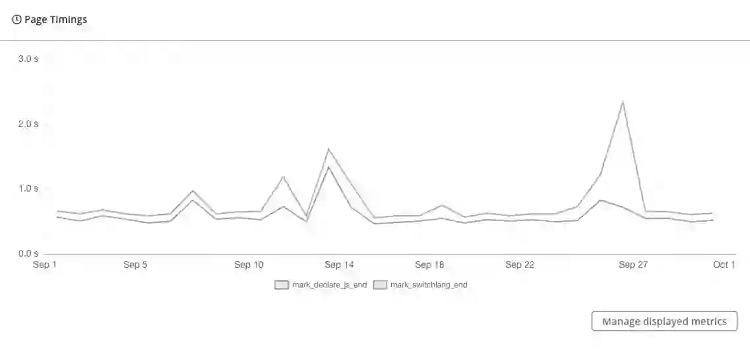
After a certain period of data collection, Google Analytics will allow you to view a curve like the one below so that you can identify the critical periods.
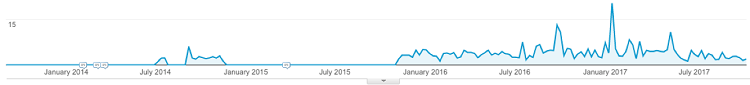
Google Analytics curve over several years,
indicating the time needed for an A/B test to display the page
Other APIs being explored for customising your web performance metrics
During his talk at We Love Speed 2019 (in French), Gilles Dubuc mentioned two other APIs being explored and tested at Wikimedia: Element Timing and Event Timing.
Element Timing allows you to assess when a given element appears on the screen.
This API responds to the need to detect when an image is loaded AND displays in the browser, which up to this point has been difficult to do without weighing down the code.
The same is true for text: detecting the moment when a block of text is actually displayed has remained complex and imprecise. It’s easy to know when a font is loaded, if its style enables it to be displayed, and its related elements, but the advent of the Element Timing API will take away all of the guesswork.
Google explains the concept here for images and here for text; the status of the research can be found here.
In practice, in HTML, the code will look like this:
[pastacode lang=”markup” manual=”%3Cimg%20src%3D%22my_image.jpg%22%20elementtiming%3D%22foobar%22%3E” message=”” highlight=”” provider=”manual”/]
And for retrieval in JavaScript:
[pastacode lang=”javascript” manual=”const%20observer%20%3D%20new%20PerformanceObserver((list)%20%3D%3E%20%7B%0A%0A%C2%A0%C2%A0let%20perfEntries%20%3D%20list.getEntries().forEach(function(entry)%20%7B%0A%0A%C2%A0%C2%A0%C2%A0%C2%A0%C2%A0%C2%A0%2F%2F%20Send%20the%20information%20to%20analytics%2C%20or%20in%20this%20case%20just%20log%20it%20to%20console.%0A%0A%C2%A0%C2%A0%C2%A0%C2%A0%C2%A0%C2%A0if%20(entry.identifier%20%3D%3D%3D%20’foobar’)%20%7B%0A%0A%C2%A0%C2%A0%C2%A0%C2%A0%C2%A0%C2%A0%C2%A0%C2%A0if%20(entry.renderTime)%0A%0A%C2%A0%C2%A0%C2%A0%C2%A0%C2%A0%C2%A0%C2%A0%C2%A0%C2%A0%C2%A0console.log(%22My%20image%20took%20%22%20%2B%20entry.renderTime%20%2B%20%22%20to%20render!%22)%3B%0A%0A%C2%A0%C2%A0%C2%A0%C2%A0%C2%A0%C2%A0%C2%A0%C2%A0else%0A%0A%C2%A0%C2%A0%C2%A0%C2%A0%C2%A0%C2%A0%C2%A0%C2%A0%C2%A0%C2%A0console.log(%22Rendering%20time%20not%20available.%20Image%20took%20%22%20%2B%20entry.loadTime%20%2B%20%22%20to%20load!%22)%3B%0A%0A%C2%A0%C2%A0%C2%A0%C2%A0%C2%A0%C2%A0%7D%0A%0A%C2%A0%C2%A0%C2%A0%7D)%3B%0A%0A%7D)%3B%0A%0Aobserver.observe(%7BentryTypes%3A%20%5B’element’%5D%7D)%3B” message=”” highlight=”” provider=”manual”/]
Event Timing will make it possible to measure the time needed for a user action to be processed by the browser (for example, a click). The project is detailed here by Google and the status of progress can be found here.
So, if you’re interested in improving your loading times and generic metrics don’t allow you to measure exactly what you want, custom metrics are just what you need!
It takes a little effort to implement them, but they are very useful for your business because they allow you to focus on specific elements of a page, whether to mark the start of an event or the duration between two events.
Find out more about the best practices and techniques
to improve the loading speed and user experience of your website: