


There is no shortage of indicators to measure the performance and quality of your e-commerce site. But beyond vanity metrics , which performance indicators should you focus on to boost your sales and really increase your turnover ?
For an overview of your business results, but also to detect levers for improvement and possible performance regressions , you must identify the right tools and metrics. Unsurprisingly, Google Analytics remains essential, but for a thorough understanding of your performance, it is in your best interest to complete your data, especially for e-commerce!
Here are some examples of tools, some of which we will detail later, to observe your results from different angles:
- For business : tracking and CRM tools (Hubspot, Salesforce, Pipedrive, etc.) for monitoring your direct marketing and customer relations, your turnover, your conversion rates, etc.
- For SEO : Google Search Console, Screaming Frog, Ahrefs, SEMRush… to evaluate the relevance of your content and keywords, the impact of your SEA campaigns, your ranking by search engines…
- For web performance : WebPageTest, GTMetrix, Dareboost, DevTools, PageSpeed Insights , Lighthouse … to evaluate your loading speed, and understand what you need to optimize to improve your user experience and therefore your conversions (in particular by measuring Core Web Vitals , the metrics highlighted by Google which bring UX and SEO even closer together).
Are all these tools and metrics making you dizzy? Consider prioritizing your KPIs based on your most important goals before rolling up your sleeves!
Organize your efforts according to the results you are aiming for:
- strengthen your notoriety and increase your traffic with SEO,
- improve your company’s image and build trust with a quality experience on your website,
- highlight your services/products,
- boost your conversions,
- reduce your bounce rates…
It is by defining these priorities that you will be able to prioritize your projects and your projects , knowing that they are obviously linked to each other, and that the beneficial effects often manifest themselves by domino effect.
You will see that loading speed is at the heart of your business , as it will impact the quality of the user experience as well as your SEO, and consequently your sales.
Indeed, the faster your pages load, the more engaged and satisfied visitors are , and therefore able to continue their purchasing journey to the end to add items to the basket, or subscribe to the service, and proceed to payment.
Here are some facts to help you better understand the risks of a slow website on your business:
- 70% of visitors to a site continue their journey on another platform, offline, or end up not buying anything if a site is too slow;
- 1 second more loading time on mobile means +8.3% bounce rate , -3.5% conversions and -9.4% page views ;
- Pages that load in less than 1 second have a 2.5x higher conversion rate than those that load in 5 seconds or more.
Revenue, conversion rate, SEO, Core Web Vitals, PageSpeed score… everything is linked! So, let’s take stock of 5 KPIs to follow closely to measure the performance of your e-commerce site.
Increase your revenue and conversion rates
The key and most important indicator to monitor is revenue generated from sales , and this is true regardless of the sector of your e-commerce site and the services or products offered.
Your ultimate goal is to convert , and you also probably need to assess the share of digital and marketing in your overall turnover.
In the Google Analytics dashboard, you can identify the acquisition channels that perform best and understand how traffic is directed to your site. Several criteria come into play in the direction of your traffic : your offer, your marketing actions, your SEO / SEA campaigns … But one thing is certain, if your site is slow, your efforts risk going down the drain. Every second (and even millisecond) counts on the internet . By the way, did you know that according to Google, 0.1 seconds less loading time can save you up to 8% in conversions ?
Here is a good way to measure the impact of speed , and the business potential of your online store with optimized pages: it is another (free) tool that Google makes available to you, it is called Test My Site .
The results are revealing, and also allow you to realize the loss of revenue if your front-end is not optimized for light and fast pages.
It would be a shame to waste your efforts and budget invested in promotions, marketing and sales actions or paid campaigns, because of a slow site that frustrating a visitor who will not go to the end of the sales funnel.
We have carried out the test for several retail verticals whose sites are not optimized: the loss of revenue sometimes reaches several million euros per year !
Reduce your bounce rates
When new Internet users arrive on your site, they must be captivated from the first few seconds. Indeed, it only takes 1 /20th of a second to form an opinion on the quality of your online store, and therefore on the image of your company. Your customer experience must be impeccable, this is especially true for new customers and prospects who must be convinced very quickly of the value of your services, and who may be less patient than your already loyal customers. With a good user experience, you stand out from the competition and attract the trust of Internet users, which helps you convert prospects into customers and move them through the online purchasing process.
In any case, a slow site is likely to make you want to leave, probably to a competitor: 43% of visitors say they will go to a competitor’s site for their next purchases if the experience is bad. Indeed, 53% of visitors leave a page if its loading time is longer than 3 seconds according to Google.
This is why it is essential to take care of your e-commerce site by offering quality content, rich in information, optimized, with an easy-to-use interface.
As you will have understood, loading speed has a significant impact on the formation of first impressions, as well as on the bounce rate. It is also a real lever for limiting bounces , as our customers can testify, who optimize their loading speed automatically thanks to our SaaS solution:
- Villages Clubs du Soleil has reduced its bounce rates by 20%,
- Phildar reduced its bounce rate by 10% and increased its conversion rate by +42% ,
- Minelli reduced its bounce rate by -30% and increased its conversion rate by 16%.
If you want to learn more about the common causes of a high bounce rate, and techniques to reduce it, check out our dedicated content .
Monitor your organic (SEO) and paid (SEA) traffic
Natural referencing and paid referencing are essential means of acquiring traffic . It is important to follow the path taken by Internet users and to study each step of the conversion funnel allowing them to arrive on your online store. Indeed, SEO is a main lever for certain websites: according to a study of different retail verticals that we conducted, traffic comes on average nearly 45% from SEO, and on average 7% from SEA, or more than half of the overall traffic. We can clearly see that SEO has a significant place in the sources of acquisition.
Maybe this is the case for your e-commerce site? To track your campaigns and measure their impact , Google Analytics gives you access to all acquisition sources and allows you to identify your main acquisition channels in the dedicated tab, as well as evaluate their impact on conversions.
 Distribution of traffic acquisition sources for a site, in the Acquisition tab
Note that Google takes loading speed into account in its algorithm for natural referencing ( Page Experience update ); and that it is also an optimization lever for your paid referencing campaigns because it helps to improve your Quality Score (and therefore reduce the cost of your paid campaigns and advertisements). Indeed, a good Quality Score can lead to up to -50% on the price of ads , while a bad Quality Score can lead to an increase of 400% – an x8 difference in the cost of ads. You can thus increase your advertising revenue and reduce the bidding costs for your ads.
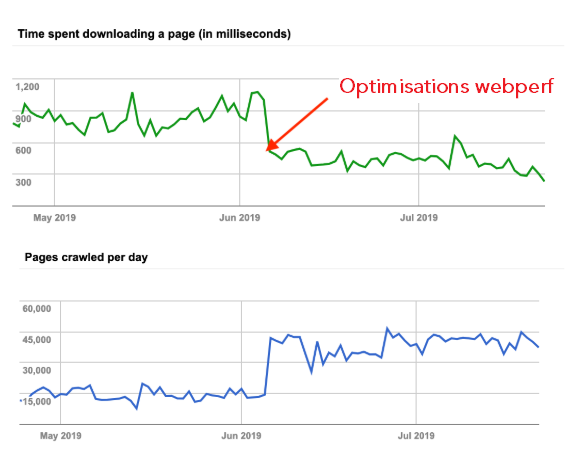
But in concrete terms, what is the correlation between speed and SEO ? It’s very simple: the faster the pages of your site are, the more Google can crawl a large number in a minimum of time to index them. The speed criterion can also help the search engine to decide the ranking between two pages of equivalent quality. It’s an additional lever to get ahead of your competitors in the search results !
Here are some data to understand the impact of speed on SEO:
- Rue Du Commerce observed an increase in the number of pages crawled by Google after optimizing the speed of its site;
- SantéVet multiplies by 4 the number of pages considered fast by the Search Console by optimizing its loading speed;
- Alltricks observed +25% SEO traffic by speeding up its web pages.
Optimizing your Core Web Vitals for better SEO
By now, it’s probably obvious to you that loading speed goes far beyond browsing comfort, the issues are also business and SEO . Yes, everyone wants a fast site: your users, but also Google.
But how does the search engine evaluate the quality of the user experience and speed?
With 3 webperf metrics known as Core Web Vitals :
- The Largest Contentful Paint (LCP), which represents the moment when the largest element in terms of size appears on the screen. It must occur within the first 2.5 seconds after the page begins loading;
- The First Input Delay (FID), which reflects the responsiveness of your page, and which must be less than 100 milliseconds to be considered good by Google;
- The Cumulative Layout Shift (CLS), measures visual stability, a score that must be less than 0.1.
So, if you want to make your site’s pages climb in the first results of Google, don’t lose sight of these essential indicators! With rich content and blog articles (but rich content that does not degrade loading speed ), quality, and a good user experience, you are on the right track to delight the Google robot… and gain places against your competitors in the search results.
Improve your PageSpeed Insights score
Finally, let’s talk about PageSpeed Insights , Google’s tool that evaluates the quality of your user experience by calculating a performance score between 0 and 100.
![]()
It also allows you to get tips and information to improve the loading speed of your pages.
The PageSpeed Insights score is calculated from several webperf metrics , each with a different weight, including Core Web Vitals which represent 70% of this score.

Distribution of webperf metrics taken into account in the calculation of the PageSpeed Insights score:
First Contentful Paint, Speed Index, Time To Interactive and
Core Web Vitals (the FID is here replaced by the Total Blocking Time)
If you get a bad score, it’s a sign that you need to improve your loading speed, but it doesn’t mean that your user experience is completely bad.
It is important to know that the browsing conditions simulated to collect the data are far from optimal . Indeed, PageSpeed simulates the display of your pages on a mid-range mobile in “Slow 4G”, a context that does not necessarily represent that of your real visitors. What you need to remember is that you cannot summarize the speed and performance of pages in a single score.
In addition, Google offers recommendations to improve your score, but we advise you to remain vigilant ! You should not rush headlong into applying them to the letter, because each optimization must be implemented intelligently.
However, some optimizations remain essential good practices for loading speed, and while the method for implementing them may be specific to each website, the principle remains interesting in all cases.
Let’s take some examples of levers for optimizing Core Web Vitals:
- To optimize your FID , keep an eye on your JavaScript code and third-party scripts, prioritize them to allow your pages to react quickly if your users click on them;
- To optimize your CLS , be sure to reserve locations for your dynamic content, so that when it is loaded by the browser, it does not shift the entire content of the page;
- To optimize your LCP , use a CDN, compress your images , avoid JavaScript and CSS that block the rendering of the page…
All of these techniques deserve precise configuration based on your technical context and business needs, and know that you can automate them to save time and ensure that the optimizations are structured correctly.
In conclusion, monitoring your overall performance is essential to guide your efforts , and this data allows you to know if you are going in the right direction or if you need to adjust your aim, and how.
After deploying your marketing and sales operations, and optimizing your website (UX, CX and SEO, etc.), some results will be visible quickly (i.e. a better PageSpeed score indicates that your optimizations are effective), and others need more time to bear fruit (i.e. in SEO, if you optimize content for SEO, it sometimes takes time for the ranking to evolve, and therefore see the effects on your place in this ranking).
Regarding loading speed, to be sure of reaching the set objectives, planning a performance budget for your site is the best way to have safeguards and to get all the teams on the same page for a fast site over time. All stakeholders (marketing, product, technical, UX teams, etc.) are informed of the requirements to be met to maintain performance, and each site development project can be subject to arbitration based on objective criteria.
More precisely, a performance budget consists of defining objectives and indicators to follow , thresholds to reach or not exceed to ensure the speed of all your pages, for all your users, whatever their network quality and geographic area, or their device model (you should know that in 2021, 64% of traffic worldwide comes from mobile ).
To take action and manage your web performance internally, you must ensure the level of expertise and availability of your technical teams, and be able to maintain performance over the long term, which is far from being an easy task.
Automation is the key to benefit from the best optimization techniques, the best formats, but also to maintain their effects in the long term , without mobilizing technical teams on support or maintenance issues. This is exactly the role of our front-end optimization engine , which also gives you access to dedicated support and guidance to improve your skills on web performance and obtain expert advice.
And since we’re talking about business KPIs , you should also know that the ROI of our SaaS solution is assured, given that the minimum threshold of speed improvement observed on average among our customers allows the investment to be profitable. Indeed, faster pages lead to an increase in conversion rates (we saw it earlier: -01s = +8% conversions on average), and they reach +40% among some of our customers !
So, whether you have a webperf optimization, redesign or migration project to improve your loading speed, or you have an already fast site for which your technical teams need to be relieved , let our experts guide you!
To learn more about the key metrics that impact your loading speed,
how to measure and optimize them:


