


Have you heard about Insight, the Fasterize solution that allows you to analyse rapidly and for free the speed of your website? Thanks to Insight, you could be taking the first step towards the optimization of your web performance: a preliminary diagnosis which is essential to make your website faster, improve the user experience and thus generate more business. Here’s how and why you should use it without moderation.
How it works: Insight measures the speed of a website by simulating the user conditions (location, connectivity, browser, device) on the principle of Synthetic monitoring.
We rely on WebPagetest to collect data about the speed of your web pages and to obtain a detailed comparison of the performance of your website with and without Fasterize.
How to test the speed of your web pages by using Insight
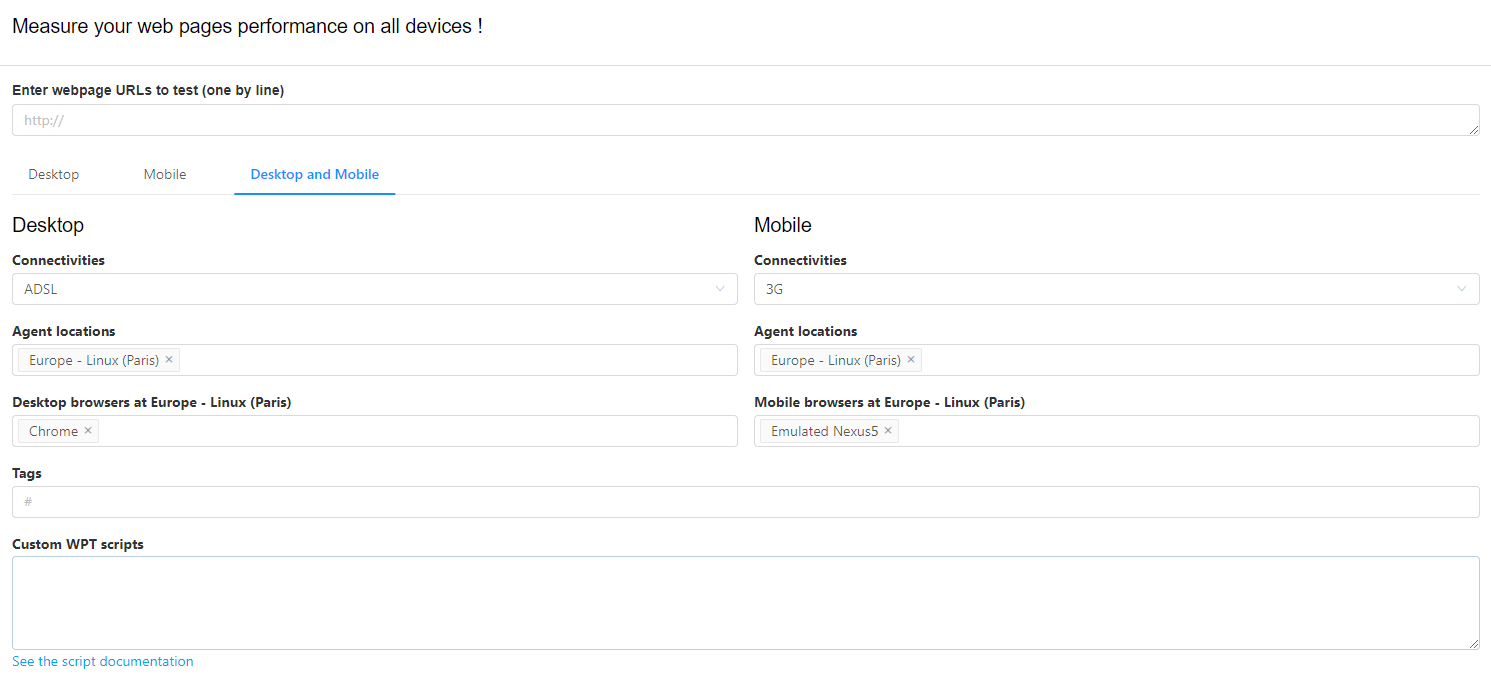
With Insight, it all starts with the setting of your request. Simply fill in the URL of the page you want to test and choose the device (desktop or mobile). You can add as many URLs as you want – homepage, product page, category page – and observe the speed on both devices.
Advanced options are available for a finer research. In order to do do this, you will need to log in by clicking on the Log In button. Once logged in, you will see a “Show settings” button under the input field of the URL about to be tested.
Here below are the different parameters you can define in the advanced settings. Desktop and mobile each have their own separate tab.
- connectivity
- localisation
- browsers
- tags.
A field is also provided for custom scripts to specify the DNS resolution for instance or the response time of the server …
For the moment, the Login works with a Gmail address. We plan to offer identification with other e-mail addresses, or also your Facebook, LinkedIn, Twitter account …
In addition to the advanced settings, logging in allows you to access a personal space where you may save your reports and find them easily. These reports are attached to your user account (and no longer to your browser) so that you can look them up at any time.
At that point you are surely wondering what you will find in your report, how to read it, or how Insight actually works? We will explain everything !
What web performance metrics will you find on Insight?
What if the numbers are red? Don’t panic!
Firstly, be aware that tests are run with Fasterize’s default configuration. By changing this default configuration, the results may be better. You can contact our support team via the form below if you need any help.
In addition, the objective is not necessarily that everything is green, but that your priority metrics are green. For example, the Speed Index and the Start Render are more important in terms of user experience than the Visually Complete. Indeed, users start interacting before the elements of a page are fully displayed.
Specifically, here’s how to read your report and what each indicator stands for.
More about Insight’s results
- Speed Index: time it takes for the user-visible content to appear.
- Start Render: time it takes for the first contents to appear on the blank page.
- Time to first Byte: time it takes for the network and the server to generate and start sending HTML. This data corresponds to server operations, however if the TTFB is high it will have an impact on the Start Render and the Speed Index.
- RUM First Contentful Paint (beta): time it takes for the first image or text elements to appear, aside from the background image.
- RUM First Meaningful Paint (beta): time required for the first contents of interest to the user to appear (the picture or the description of a product for example).
- Visually Complete: time it takes for the last item to load onto the user-visible page.
- Page Size: total weight of all elements of the page.
- Request Number: total number of requests generated by the page.
- Load Time: loading time of the page, from the opening to the finalisation of the display of all elements by the browser (NB: the relevance of this indicator depends on the way the page is built).
Below these data, you will find the summary of your request.
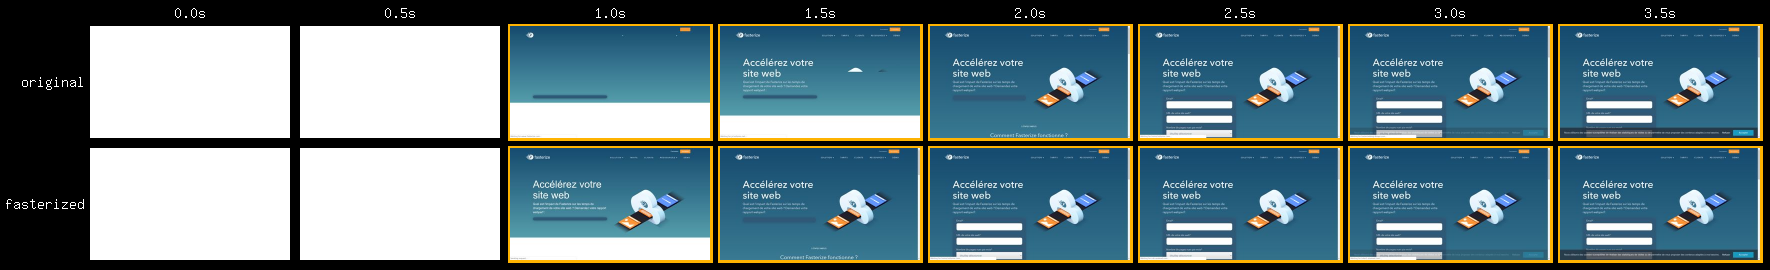
Filmstrip: displaying your page step by step
Which elements are visible first? How long does it take for your page to load? The Filmstrip section shows you step by step how your page appears to the user, with and without Fasterize. You can vary the interval and download the animation to share it internally with your Marketing and IT teams. Sometimes images speak for themselves better than words or numbers.
Video: Real-time rendering of your “Fasterized” page
In split screen mode, view the loading progress of your page and compare between the original version and the “Fasterized” version. Convincing? You can also download the video and share it.
“My Reports” section
This page lists all the comparative tests you have launched. You may click on one of the right-hand side icons in order to:
- View a report
- Copy the report URL and share
- Restart the test if you made alterations to a page
- Delete the test.
You also have the possibility to copy multiple URLs at once with the “Bulk Actions” button, or search for tested URLs by filtering their content.
Any questions about how to read your Insight comparison reports?
Do you want to take action and go further in improving the speed of your website and your web performance?


