


As of this writing, there is still a lot of uncertainty and confusion surrounding the announcement of the Google Page Experience update. Here is what we know about this update, which was announced in 2020 and rolled out in May 2021.
The original article can be found in English on Simon Hearne’s blog .
Google Page Experience update in summary
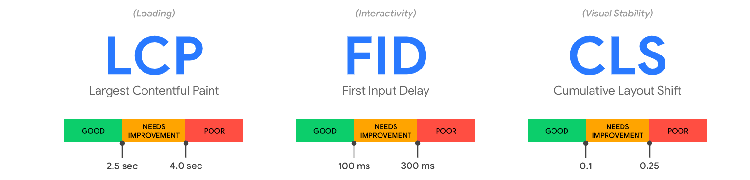
Google’s Page Experience update scheduled for May 31, 2021 (editor’s note: you can find a dedicated article here in French ) will make Core Web Vitals a signal relating to the quality of the user experience, in the context of mobile searches only , for groups of similar URLs . For the signal to be positive, the 3 Core Web Vitals will have to meet the thresholds recommended by Google. The impact on ranking in search results should be quite low.
“Meeting the goals” set by Google means that the overall value of the 75th percentile , on a set of similar URLs, reaches these thresholds that allow the speed of web pages to be considered “good”. To be considered fast, pages must meet the criteria indicated below (2.5 seconds for the LCP , 100 milliseconds for the FID and a score of 0.1 for the CLS ).
The results are aggregated from CrUX data collected by Google, which you can find in Search Console , which is considered the most reliable source of information by Simon Hearne .
Google groups similar URLs together
As you can see in Search Console, Google creates groups of URLs that it considers similar. The aggregated scores for each of the Core Web Vitals for these sets of pages, which appear in Search Console, will likely be taken into account from Page Experience update onwards, rather than the performance of individual web pages.
To see the details of the URLs grouped by Google, you can click on “ Similar URLs ” and see up to 20 URLs that the search engine has included in a given group.
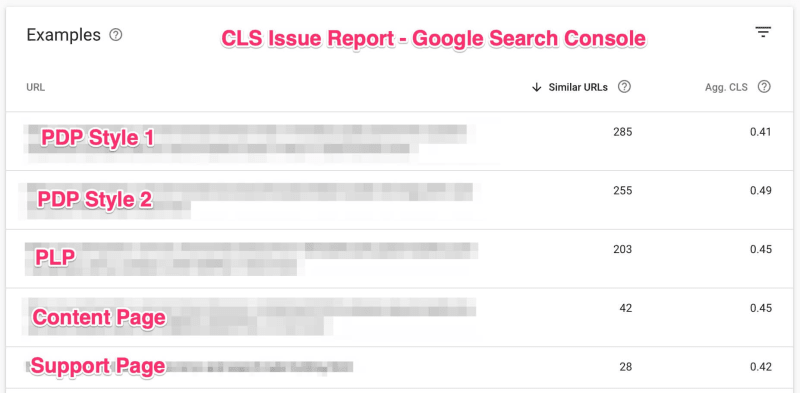
The CLS report in Google Search Console shows grouped URLs
Field data matters more than synthetic data (Lab)
Field data is collected from real users as they browse the web . This data counts for Page Experience , while synthetic data (Lab data), collected by simulating browsing, may not represent the real user experience, and therefore may not impact SEO.
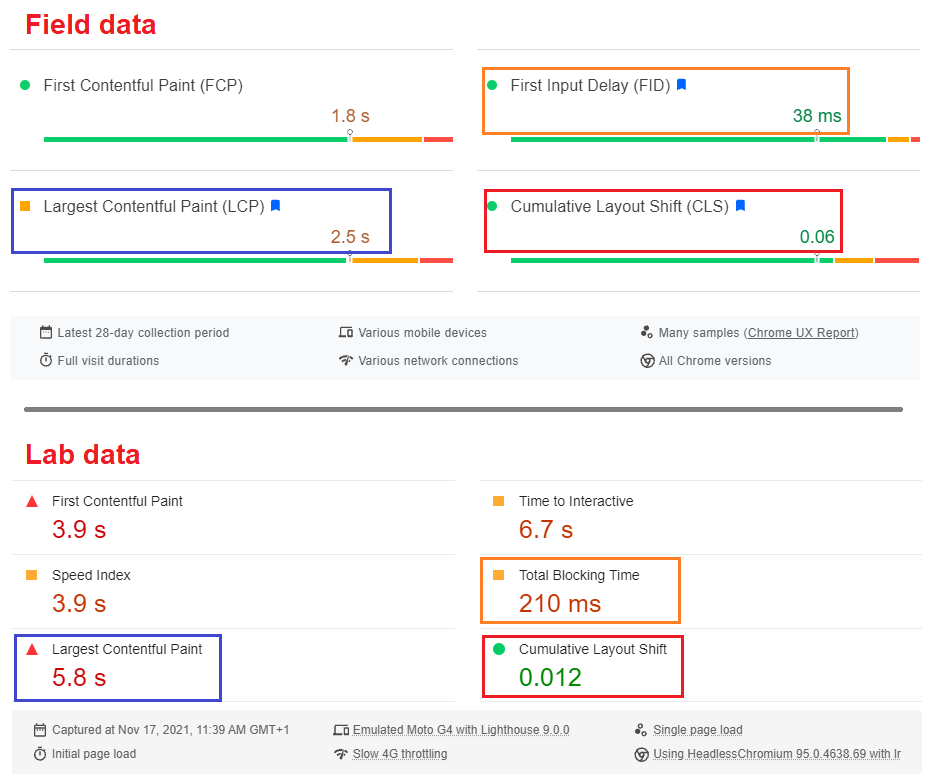
The results observed from field data and synthetic data are different
Differences between results for Lab data and Field data can be due to many factors related to your traffic:
- the geographical area of the Internet user and the quality of the network (LCP),
- layout differences depending on viewport size across screens and devices (CLS),
- performance differences across mobile device models (FID).
Lab (or synthetic) data is still useful for diagnosing a problem and confirming an improvement, but it is better to rely on field data to understand the real user experience.
Also note that the Lighthouse score (editor’s note: which is used as the basis for calculating the PageSpeed score ) is established from lab data, not field data!
The truth comes from Search Console
While you can measure your Core Web Vitals using a multitude of tools:
- PageSpeed Insights (Lab and Field)
- WebPageTest (Lab)
- Real User Monitoring tools such as mPulse (Field)
- Chrome UX Report (Field)
…none of them directly reflect the values that will be taken as a signal for SEO.
The closest data you can get on a web page’s performance, as used by the search engine, outside of Search Console is in PageSpeed Insights Field Data.
This portion of PageSpeed’s results provides the only public source of page-level data, and uses the same 28-day rolling window as the ranking algorithm – except that the values shown are for the individual URL tested, not the aggregate of pages grouped together as in Search Console.

Google Search Console displays groups of pages that don’t meet Google’s criteria for Core Web Vitals. Data comes from CrUX.
Core Web Vitals and Page Experience update: what to do
The approach Google is proposing with the Page Experience update is more carrot than stick. There is no direct penalty to fear if the criteria are not met. However, meeting the objectives set by Google will inevitably lead to an improvement in the user experience. Use the tools available to determine which pages of your website you need to optimize, and get to work on it! (Simon Hearne has a detailed article on the subject, in English: “ Diagnose and optimize Core Web Vitals ”)
Keep in mind that any changes you make to your website pages will take 28 days to show up in the data Google reports – so don’t expect immediate changes.
How to assess Core Web Vitals?
Core Web Vitals lean towards what Simon Hearne calls “Good Thing™️” .
They push to focus on user experience, not just technical metrics .
- Google’s update creates a bridge between SEO, Technical SEO, Marketing, Performance and Engineering.
- Relying on real data encourages greater interest in users, compared to only looking at synthetic data.
- The fact that Google sets targets based on the 75th percentile is a good compromise between the median (difficult to impact) and the 90th/95th percentile which are often fickle.
But the Core Web Vitals also show some limitations:
- Metrics are only measured on Chromium-based browsers.
- The SEO benefit is determined solely by the performance of visitors using the Chrome browser.
- First Input Delay (FID) is highly dependent on when users interact with a web page (if they do at all), making this metric less “actionable” than its synthetic data equivalent Total Blocking Time (TBT), or “ Max Potential FID ”.
It’s worth noting that at this point, Google’s Core Web Vitals goals are pretty strict. Many Google pages aren’t “good” for all three metrics, and very few websites achieve them. That said, it’s possible to check all the green boxes without doing any major development, which makes them good goals: tough but achievable .
Other SEO factors
Please note that AMP will no longer be a requirement to appear in the Top Stories carousel in mobile search results after the Page Experience update; pages that meet the Core Web Vitals criteria will be eligible .
Page Experience update: what remains to be confirmed
Until the Page Experience update, some assumptions still need to be validated by Google:
- CrUX is the data source that Google takes into account (there is no official confirmation).
- URLs are grouped together to represent a ranking signal , and Origin Summary is used for new/ungrouped URLs. But how much control can we have over this grouping? Sometimes it doesn’t follow logical patterns and can group pages from different categories together.
- How many users and journeys are included in the CrUX dataset; and also, what proportion of users have given consent to share their usage statistics, and what sampling (if any) is applied?
- Is geography a factor? For example, does the TTFB measured in a country determine the ranking in that country?
- Cumulative Layout Shift (CLS) unfairly penalizes Single Page Apps (SPAs), and while there is a proposal to improve this metric, we cannot yet confirm when it will be available.
Hopefully these points will be confirmed before May 31, 2021, if only for the sake of clarity and transparency, because it is difficult to aim at a moving target.
Is there any information to add about Core Web Vitals?
Sure! Core Web Vitals information is gathered from videos, blog posts, and tweets—and finding reliable sources of information can be a challenge. If you have different ideas than what you’ve read in this article, let us know!
If you’d like to learn more about Core Web Vitals,
what they measure, and how to optimize them:


