


You have just received your webperf diagnosis with 1000 and one figures and you may be wondering: what do all these figures correspond to? Why are there so many? And above all, how do you compare to your competitors?
Well, we will try to answer all your questions here. Let’s go!
Among the lot, you probably already know some of them. Maybe you even monitor them already! The other KPIs will also speak to you very quickly. This is for a simple reason: we have all already experienced the irritation in front of a site that does not display quickly enough!
Let’s start with the first number of your diagnosis:
The PageSpeed score

The PageSpeed score is a web performance score for your site, according to Google. To obtain it, it’s very simple: just enter your URL on PageSpeed Insights . The tool gives you a score between 0 and 100 after a few seconds.
According to Google:
- from 0 to 49: a web page is slow,
- from 50 to 89: a web page is moderately fast,
- from 90 to 100: a web page is fast.
To understand in more detail how this score is measured, we invite you to read our article ” Google PageSpeed Insights: why my score is bad “.
The PageSpeed score has the advantage of grouping many webperf metrics in the same algorithm and thus having a global view of your web performance. It is particularly ideal for communicating internally and avoiding getting lost in many metrics.
The average mobile PageSpeed score in e-commerce
Sure, you now know when your site is slow according to Google. But what about the rest of the market?
We launched tests on the top 30 most visited e-commerce sites in France and the average mobile PageSpeed score is 42.
And here is the top 5:
| Ranking | URL | Mobile PSI Score |
| 1 | nocibe.fr | 90 |
| 3 | etsy.com/fr | 84 |
| 4 | fr.shopping.rakuten.com | 75 |
| 5 | leroymerlin.fr | 74 |
Now let’s move on to Core Web Vitals!
Core Web Vitals
Once again, it is Google that is hiding behind the Core Web Vitals. Indeed, Google has always attached importance to display speed and the engine has also carried out numerous experiments in recent years. But aware that there were many parameters to take into account to improve the performance of websites and that it was not easy to understand at a glance where the UX and Front-End Optimization (WPO) problems were, nor to resolve them; Google came up with the “Core Web Vitals” (or Essential Web Signals ).
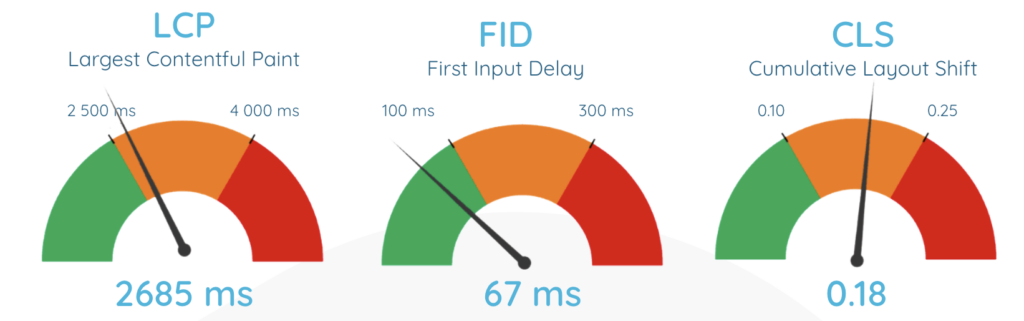
Each of these Core Web Vitals represents a facet of the user experience:
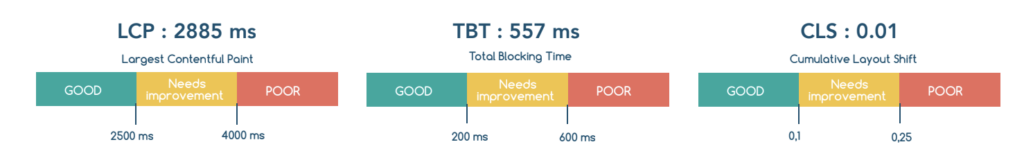
- For page loading: the Largest Contentful Paint (LCP), i.e. the moment when the largest content in terms of size appears on the screen (text, image, etc.), is the indicator used to evaluate display speed. For a good user experience, the LCP must occur within 2.5 seconds of the start of page loading (editor’s note: compressing images is one of the best practices that contribute to a good LCP).
- For interactivity: First Input Delay (FID). For a good user experience, pages should have a FID of less than 100 milliseconds ( editor’s note: optimizing JavaScript contributes to a good FID ).
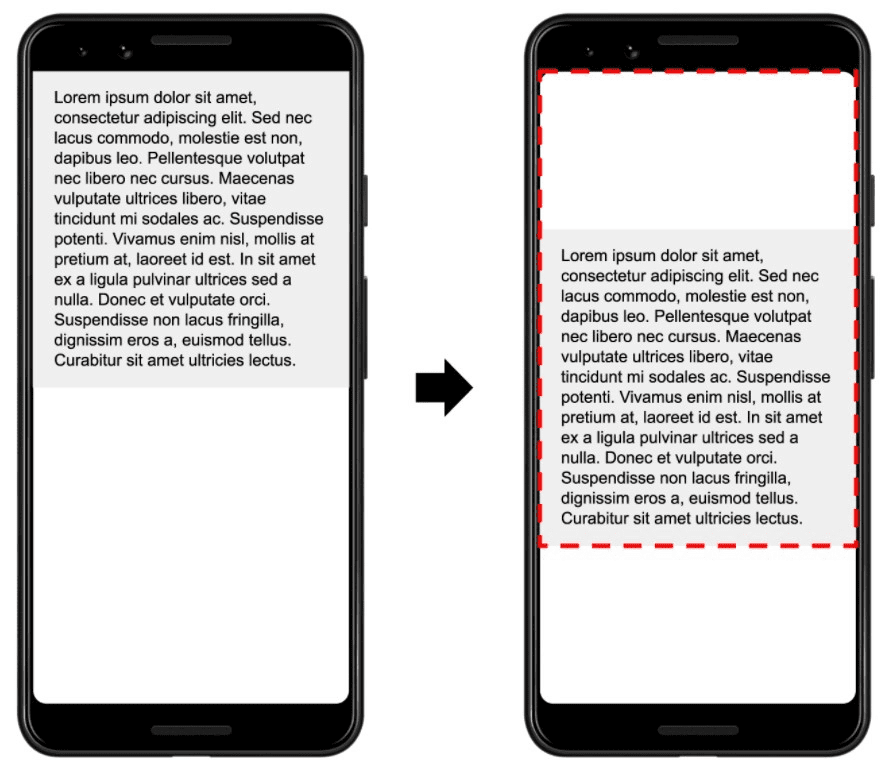
- And finally for visual stability: the Cumulative Layout Shift (CLS). For a good user experience, pages should keep a CLS below 0.1.
Note that since the Page Experience Update, Core Web Vitals are taken into account in Google’s ranking algorithm!
Now that you are clear on these 3 metrics, you have probably already noticed that your diagnosis does not report the First Input Delay (FID) but the Total Blocking Time (TBT). We explain why!
Why TBT instead of FID?
FID is a Field metric ( RUM ) and cannot be simulated in a Lab environment ( Synthetic Monitoring ). Indeed, real user interaction is required to measure a response time.
For an equivalent metric to FID with Synthetic Monitoring tools, we can look at Total Blocking Time (TBT) . While FID and TBT don’t measure exactly the same thing under the same conditions, improvements to TBT usually improve FID. That’s why we had to focus on your TBT in our testing.
Average Core Web Vitals in e-commerce
We know you love benchmarks, so to help you see things more clearly, here are the average Core Web Vitals of the top 30 most visited e-commerce sites in France:
To get Google’s favor, there is no question of having only one Core Web Vitals in the green. Google requires that your 3 Core Web Vitals are in the green to consider in its ranking algorithm that your site is fast.
However, as you can see, although e-retailers have taken the subject seriously, the average Core Web Vitals on the market do not meet Google’s requirements. When we take a closer look at the top 30 e-commerce sites, we see that only 1 in 2 e-commerce sites manage to obtain the Holy Grail of the 3 Core Web Vitals in green.
At this point in your reading, you may be wondering about the impact of your Core Web Vitals on your ranking. To learn more about this topic, we invite you to watch the replay of our webinar: Web performance & SEO: what results?
And if you want to have a brief overview, here is a video summary !
Let’s move on to the next metrics. Indeed, we didn’t stop at the metrics favored by Google. Why? Because, in our opinion, they are not enough. Whether for your SEO or for your users, there are 3 additional metrics to follow.
The Time To First Byte (TTFB)
Time To First Byte (TTFB) expresses in milliseconds the response time of a server.
When a user visits your website, the browser requests information from a server (origin, remote server, CDN, etc.) which sends it to display the elements that must appear on the page. This time required for the server to send the first byte to the browser is represented by the Time To First Byte (TTFB) – not to be confused with the Start Render or the First Contentful Paint , which indicates the moment when the first content element is displayed on a page.
Why is Time To First Byte important?
- It helps to detect application slowness (database, search engine, microservices, etc.)
Server response time is directly related to the speed at which data is retrieved by the browser. Also, if the server response time is high, the fluidity of the site is affected, the browsing experience is degraded, your Internet users are frustrated by having to wait for the page to load and end up leaving it if this delay is too long – at best without having read or bought anything, at worst to go to a competitor.
- It is related to SEO performance
Server response time is an important criterion for your SEO. Indeed, in addition to the page loading time, the faster your server responds, the easier Google robots can crawl pages. While we cannot affirm the link between webperf and SEO ranking , we observe a correlation between the speed of a site and the number of pages crawled, as evidenced for example by Rue Du Commerce . Google also recommends not to exceed 200 ms of Time To First Byte.
The average Time To First Byte in e-commerce
For the TTFB, we suggest you observe the average of the e-commerce sites for which we carried out a diagnosis during One to One Monaco (more than a hundred). On average, the TTFB is 680 milliseconds, while it is recommended to go below the 500ms mark.
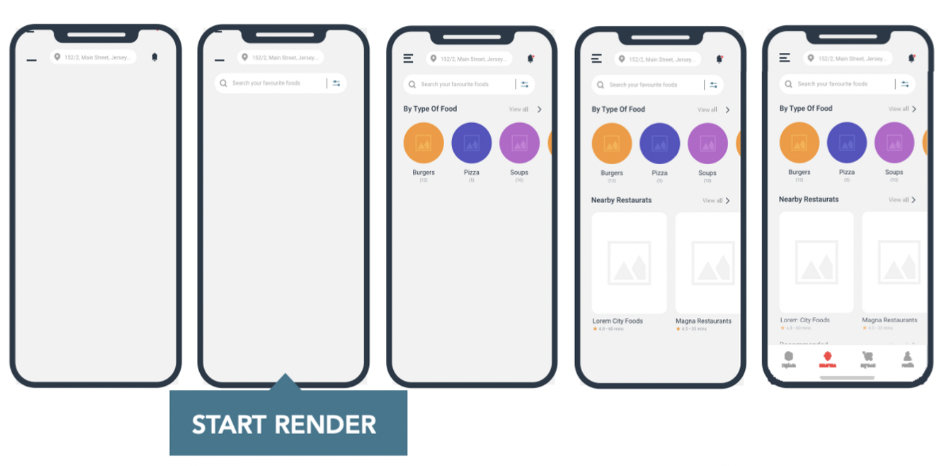
The Start Render
This metric is user-oriented. Start render tells you how long it takes for a first element to render , regardless of its size or importance (from the user’s point of view). This KPI is directly related to perceived speed .
This is the moment when the blank page gives way to the first visual elements. The start render is one of the indicators that make Internet users stay on your pages: they are less tempted to leave your web page as soon as an element is displayed .
The longer it remains white, the more you increase the risk of them abandoning their visit, or even their basket.
The Median Start Render in E-Commerce
Here too, we suggest you observe the median of the sites measured during One to One Monaco. The median Start Render is 1.43 seconds.
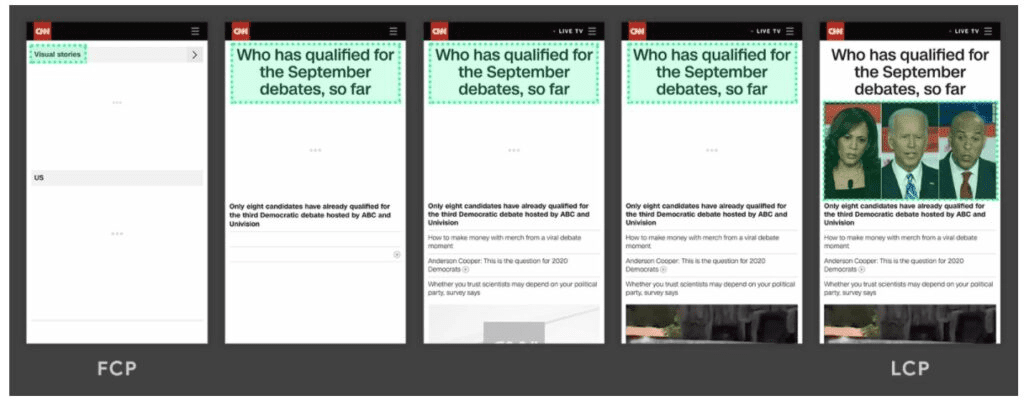
And the First Contentful Paint (FCP)
Perhaps you have in your diagnosis, the FCP. This metric is very close to the Start Render. The difference lies in the monitoring method. While the Start Render is available in synthetic monitoring tools, the First Contentful Paint is available in Real User Monitoring (RUM) tools.
The median FCP in e-commerce
The median FCP of the sites measured during One to One Monaco is 1435 milliseconds.
The Speed Index
The Speed Index is also directly correlated to the user experience. It provides information on the display speed of the area above the waterline (the viewport), taking into account the progressiveness of the display of the content and the different elements. In short, the Speed Index measures what the user sees. Here is an example of two pages, A (optimized) and B (non-optimized), illustrated by a filmstrip:

Note that this is a score that provides information over a period of time. It does not mark a given moment. To have a good Speed Index , the score obtained must be as low as possible.
The median Speed Index in e-commerce
The median Speed Index of the sites measured during One to One Monaco is 3710.
You are now clear on the different metrics presented in this diagnosis and their importance. In order to compare your performance with that of your direct competitors, we invite you to get back in touch with your point of contact at the show or to contact us directly!
In the meantime, you can always deepen your knowledge of the key web performance metrics by downloading our dedicated ebook:


