Monthly UK user experience ranking – most visited mobile sites in UK

Sommaire

February confirms a very stable top of the ranking, with Gov, BBC and Ikea maintaining their leadership thanks to consistently strong user experience across loading, interactivity and stability.

Several sites improved their performance this month:  notably PayPal (+7), Gumtree (+6) and Office (+5) showing how targeted optimisations can quickly increase the share of users enjoying a good experience.

On the other hand, some platforms experienced significant regressions. National Lottery (–41) recorded the most dramatic drop after major degradations across all metrics, while Skyscanner (–7) and NY Times (–7) also lost ground due to declines in loading or layout stability.

Across sectors, e-commerce remains relatively mature, media sites load fast but still struggle with interactivity, and travel continues to lag behind, with only 4% of sites achieving a PX Index above 90.

👉 The key takeaway: Web performance leadership is no longer about hitting technical thresholds: it’s about maintaining a good experience for the largest share of users, consistently over time.

🤖 Summarize this article with:

It’s time to take a look at this month’s webperf rankings of the most visited sites in the UK.

For more than ten years, we have been analysing the performance of the most visited websites on a monthly basis. These rankings, built on Chrome User Experience Report (CrUX) data and Google’s Core Web Vitals, have become a benchmark for assessing the market’s maturity when it comes to user experience.

Until now, websites were ranked using a score based on whether they met Google’s recommended thresholds. This approach played a key role in structuring market priorities and in democratising web performance as a discipline.

Over time, however, a limitation became clear:
a website can technically meet all Core Web Vitals thresholds while still exposing a significant share of its audience to a degraded experience.

At Fasterize, we have chosen to put the user experience at the centre of measurement. Performance can no longer be evaluated purely as technical compliance, but as a reality actually experienced by users throughout their journey.

This conviction led us to evolve our historical score into the Performance Experience Index (PX Index).
From February 2026 onwards, all of our rankings are now based on the PX Index.

A truly high-performing website should not only work well for a statistical majority, but deliver a good experience for all its users.


Le Performance Experience Index (PX Index)

The PX Index is scored from 0 to 100 and measures the real share of users benefiting from a good experience on a website. It is based on real-world user data from the Chrome UX Report, and on all the key metrics that shape the user journey : from server response time to on-screen interactions.

The overall score is calculated as a weighted average of the percentage of users having a good experience, with each metric weighted according to its real impact on perceived performance:

  • LCP represents 30%
  • CLS represents 20%
  • INP represents 20%
  • FCP represents 15%
  • TTFB represents 15%

The full methodology is detailed in this article.

With this new methodology, rankings take on a different meaning.
The goal is no longer simply to display the 75th percentile values to check whether a site “passes the thresholds”, but to show the percentage of users who actually enjoy a good experience (i.e. above the threshold).

As a result, a percentage greater than or equal to 75% means that the metric is validated according to Google’s “Good” threshold, since its 75th percentile meets the requirement.

We’re excited to unveil the new edition of our UK Speed Ranking  ! Each month, we analyse mobile web performance across:

  • 50 of the most visited websites in UK
  • 30 major e-commerce platforms
  • 20 leading media websites
  • 20 key players in the Travel sector

But before diving into the results, let’s remind ourselves why fast-loading websites are critical to online success.

Why speed matters ?

Speed isn’t just technical : it’s strategic ! Studies show that website performance directly impacts user experience, conversion rates, and revenue. According to Google, 53% of mobile site visitors leave a page that takes longer than three seconds to load. For UK e-commerce sites, this statistic is particularly concerning given the intense market competition.

A Deloitte study reveals that a 0.1-second improvement in mobile site speed can increase conversion rates by 8.4% for retail sites. These figures highlight the importance of prioritizing loading speed to stay competitive.

Let’s dive into the February 2026 rankings and analyses.

Top 50 : Webperf ranking of the top 50 most visited websites in the United Kingdom

February confirms a remarkably stable leadership at the top of the ranking, with the same trio continuing to dominate thanks to consistently strong user experience across loading, interactivity and visual stability.
At the same time, several sites made notable progress through targeted optimisations, while others experienced significant regressions that quickly impacted their ranking.

🏆 TOP 3 LEADERS

  1. Gov.uk (→ #1) retains the top position with a PX Index of 95, continuing to set the benchmark for reliable digital services. With 97% of users experiencing fast loading, 93% smooth interactions, and 98% stable layouts, the platform delivers one of the most consistent user experiences in the UK web ecosystem.

  2. BBC (→ #2) remains firmly in second place with a PX Index of 94. The site maintains excellent loading performance and exceptional visual stability, ensuring a comfortable reading experience even during periods of intense news consumption.

  3. Ikea (→ #3) completes the podium once again with a PX Index of 93. The retailer continues to demonstrate strong UX maturity, balancing fast loading, responsive interactions and stable layouts across complex product pages.


🌟 NOTABLE IMPROVEMENTS

  • PayPal (+7 → #36) One of the most significant improvements this month.
    PayPal records gains across all metrics, with +10% more users experiencing fast loading, +5% enjoying smooth interactions, and +6% benefiting from stable layouts. Interactivity now reaches the green threshold, improving overall usability.
  • Gumtree (+6 → #21)  A clear improvement in visual stability, with +7% more users experiencing stable layouts. This optimisation reduces layout shifts during browsing and significantly improves perceived page quality.
  • Office (+5 → #23) improves its loading performance, with 75% of users now benefiting from a fast loading experience, allowing the LCP metric to reach the green threshold.
  • Vinted (+4 → #28) records small but consistent improvements across several metrics, leading to a gradual but meaningful gain in ranking.
  • Temu (+3 → #9) continues its upward trajectory in the Top 10. While the underlying metrics remain largely stable, the platform benefits from the relative stagnation of competitors, consolidating its position among the leaders.


These sites reflect ongoing efforts to improve user experience, which will likely continue to positively impact user experience and engagement. These improvements are the result of consistent efforts to optimize their systems, with particular attention paid to INP. It’s worth noting that having a good FID does not necessarily mean having a good INP! FID only measures the first interaction, whereas INP assesses interactivity throughout the entire browsing session. The efforts made by these players to improve their web performance metrics are not only beneficial for their rankings but are also crucial for providing a quality user experience, reducing bounce rates, and increasing engagement on their platforms.


📉 CHALLENGES IN THE RANKINGS

National Lottery (–41 → #48) The most dramatic drop of the month. The site experiences a severe degradation in user experience, with the PX Index falling by 33 points. The deterioration affects all key metrics:

  • 63% of users now experience poor visual stability
  • 17% more users face degraded interactivity
  • 48% of users who previously experienced fast loading now face slow pages

This sharp decline suggests that the site may currently be experiencing major technical issues, or potentially undergoing structural changes that severely impact performance.

  • The New York Times (–7 → #29) loses several places due to reduced visual stability, with 15% more users experiencing layout shifts, affecting reading comfort.
  • BT (–4 → #27) also records a decline driven by visual instability, with 13% more users experiencing degraded layout stability, introducing friction during navigation.
WebsiteRankingRanking
M-1
PX
Index
LCP
(% Good)
INP
(% Good)
CLS
(% Good)
Gov1 (0)195979398
BBC2 (0)294968499
Ikea3 (0)393959093
Indeed4 (2)693969492
The guardian5 (0)592969284

See the full ranking
WebsiteRankingRanking
M-1
PX
Index
LCP
(% Good)
INP
(% Good)
CLS
(% Good)
Gov1 (0)195979398
BBC2 (0)294968499
Ikea3 (0)393959093
Indeed4 (2)693969492
The guardian5 (0)592969284
Wikipedia6 (-2)492969688
Zoopla7 (1)890948290
Ebay8 (2)1089927895
Temu9 (3)1288928196
News.sky10 (1)1188928976
Mumsnet11 (-2)988878195
Independent12 (1)1387937590
Amazon13 (1)1486918280
Santander14 (2)1685858495
Telegraph15 (0)1584908086
Asos16 (2)1884907694
Right Move17 (0)1783945879
Mark and Spencer18 (1)1983877785
Argos19 (2)2182897090
Express20 (0)2082856288
Gumtree21 (6)2780915586
Diy22 (3)2580887978
Office23 (5)2880758798
Spotify24 (2)2679787995
The Sun25 (-1)2479845684
Disney Plus26 (3)2979718180
Bt27 (-4)2378847364
Vinted28 (4)3278807290
Ny Times29 (-7)2278818159
Tesco30 (0)3077807185
Etsy31 (0)3176828896
Daily Mail32 (1)3375855387
Screwfix33 (2)3573816090
Sky34 (0)3473737969
Ancestry35 (1)3671738773
Paypal36 (7)4371737891
Netflix37 (0)3771747694
Royal Mail38 (2)4070767839
Just-eat39 (-1)3869855650
Sky scanner40 (2)4267644977
Snapchat41 (-2)3967607198
Bet 36542 (2)4467626633
Next43 (-2)4166802987
Microsoft44 (1)4562656381
Sainsburys45 (1)4660574861
Booking46 (2)4860635793
Pinterest47 (0)4757535776
National Lottery48 (-41)757457022
Boots49 (1)5056643441
Asda50 (-1)4955632947

📊 Top 50 — experience overview

ux distribution


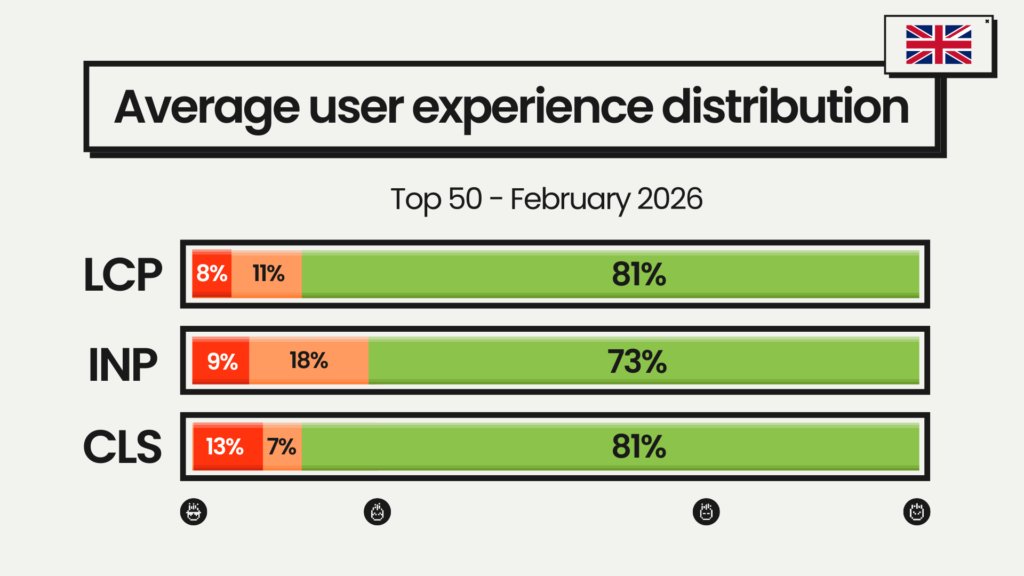
Across the Top 50, the overall picture remains relatively stable, but the data highlights a persistent gap between fast loading and truly smooth user journeys.

On average:

  • PX Index: 78
  • 19% of users still experience slow loading (LCP outside the green threshold)
  • 28% encounter degraded interactions, reflecting ongoing challenges around responsiveness (INP)
  • 20% face layout instability, which can disrupt navigation and reading comfort


Looking at threshold validation across the ecosystem:

  • 14% of sites achieve a PX Index above 90
  • 38% of sites now validate all three Core Web Vitals (up from 34% last month)
  • 54% meet the interactivity threshold (INP) (slightly down from 56%)
  • 78% maintain good visual stability (CLS) (down from 80%)

👉 Key takeaway:
While the share of sites passing all Core Web Vitals is increasing, interactivity remains the main friction point for users, with more than a quarter of sessions still experiencing slow or unresponsive interactions. Maintaining performance over time therefore requires continuous monitoring and targeted optimisations.

Loading speed and layout stability are now largely under control for most major sites.
Interactivity remains the main differentiator, and the metric that most clearly separates leaders from the rest.

Here are the e-commerce rankings, for which web performance is a business and SEO issue.

E-commerce : Webperf ranking of the top 30 most visited sites in the United Kingdom

February confirms a very stable leadership among UK e-commerce platforms, with the same three players maintaining their positions thanks to consistently strong user experience across loading, interactivity and layout stability.

While the top of the ranking remains largely unchanged, several retailers improved their performance through small but meaningful optimisations, while others experienced slight regressions that impacted their ranking.

🏆 TOP 3 – E COMMERCE LEADERS

  1. Ikea (→ #1) keeps the top position with a PX Index of 93, maintaining one of the most balanced experiences in the sector. With 95% of users benefiting from fast loading, 90% enjoying smooth interactions, and 93% experiencing stable layouts, the retailer continues to set the benchmark for UX maturity in e-commerce.

  2. John Lewis (→ #2) remains firmly in second place with a PX Index of 90, supported by a consistent experience across all metrics. Strong loading performance and high layout stability ensure a reassuring browsing environment for shoppers.

  3. Pretty Little Thing (→ #3) retains the third position thanks to fast loading and solid visual stability, offering a fluid browsing experience despite the high content density typical of fashion retail platforms.

🌟 NOTABLE IMPROVEMENTS

  • Shein (+3 → #23) records a slight improvement across all performance metrics, allowing the platform to gain three positions.More users now experience faster loading and smoother interactions, improving the overall shopping experience.

  • Matalan (+2 → #9) also benefits from small but consistent improvements across its metrics, strengthening the overall user journey and allowing the retailer to enter the Top 10.


📉 CHALLENGES IN THE RANKINGS

  • Wickes (–2 → #14) records a slight degradation across several metrics, including loading performance. Around 4% of users now experience slower loading, which was enough to impact the site’s ranking in a tightly competitive mid-table.

  • Apple (–2 → #26)  also experiences minor regressions across multiple metrics, including loading performance. Here again, around 4% of users moved from a good to a degraded loading experience, contributing to the ranking drop.

WebsiteRankingRanking
M-1
PX
Index
LCP
(% Good)
INP
(% Good)
CLS
(% Good)
Ikea1 (0)193959093
John Lewis2 (0)290948691
Pretty Little Thing3 (0)390937890
Ebay4 (0)489927895
River Island5 (0)589966996

See the full ranking
WebsiteRankingRanking
M-1
PX
Index
LCP
(% Good)
INP
(% Good)
CLS
(% Good)
Ikea1 (0)193959093
John Lewis2 (0)290948691
Pretty Little Thing3 (0)390937890
Ebay4 (0)489927895
River Island5 (0)589966996
Temu6 (1)788928196
Aldi7 (-1)687888392
Sports Direct8 (0)887946589
Matalan9 (2)1186897196
Amazon10 (-1)986918280
Very11 (-1)1085917590
Asos12 (1)1384907694
Marks And Spencer13 (1)1483877785
Wickes14 (-2)1282816984
DIY15 (0)1580887978
JD Sports16 (0)1678887864
Vinted17 (1)1878807290
Tesco18 (-1)1777807185
H&M19 (1)2075895466
Nike20 (-1)1975777481
Screwfix21 (0)2173816090
Halfords22 (0)2271796168
Shein23 (3)2668766275
Samsung24 (-1)2366736251
Next25 (0)2566802987
Apple26 (-2)2466558278
EE27 (0)2762587061
Boots28 (0)2856643441
Uber eats29 (0)2940323074
Iceland30 (0)3034282238

📊 E-commerce experience overview

ux distribution ecommerce

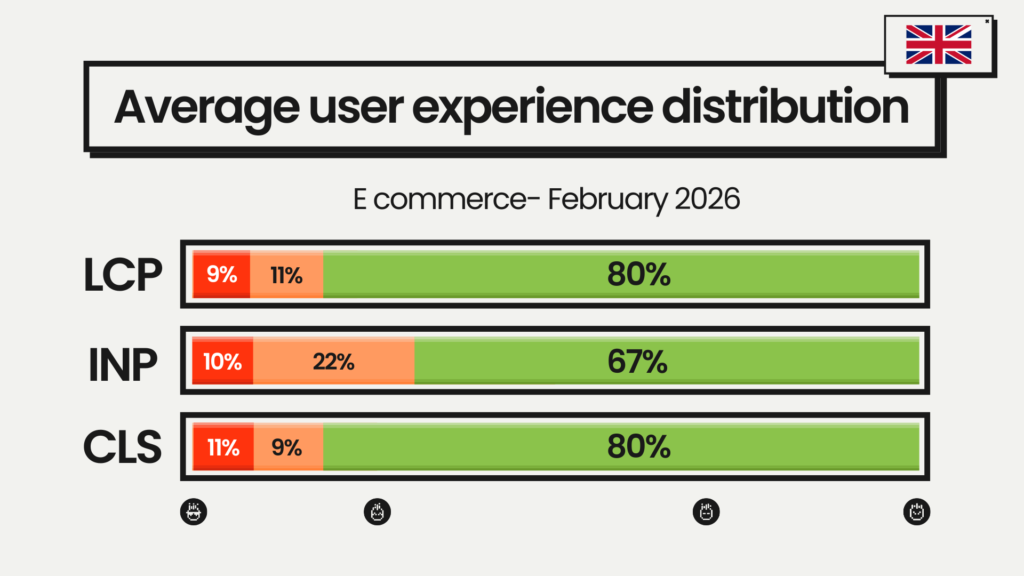
At sector level, e-commerce continues to show solid foundations, particularly in loading performance and layout stability. However, interactivity remains a structural challenge.

On average:

  • PX Index: 76
  • 20% of users still experience slow loading (LCP outside the green threshold)
  • 33% encounter degraded interactions, highlighting persistent responsiveness issues
  • 20% experience layout instability, which can disrupt browsing or checkout flows


Looking at threshold validation:

  • 10% of sites achieve a PX Index above 90
  • 37% of sites validate all three Core Web Vitals
  • 80% meet the loading threshold (LCP) (up from 73% last month)
  • 43% meet the interactivity threshold (INP)
  • 73% meet the stability threshold (CLS) (down from 80% last month)

Most e-commerce sites now load fast and remain visually stable, but interactivity is still the main bottleneck. Improving how quickly pages respond to user actions is now the clearest lever to stand out, reduce friction, and protect conversion during high-pressure periods like sales.

👉 Key takeaway:
Most e-commerce platforms now load quickly and remain visually stable, but interactivity remains the main bottleneck. Improving how quickly pages respond to user actions is becoming the clearest lever to reduce friction, improve engagement and protect conversions during high-intensity periods such as sales.


Media : Webperf ranking of the top 30 most visited sites in the United Kingdom

February confirms the strong maturity of UK media platforms in terms of loading speed, with most sites delivering fast access to content. However, maintaining smooth interactivity and consistent visual stability remains a challenge for a significant share of publishers.

The top of the ranking remains dominated by long-standing leaders, while several outlets improved their responsiveness and gained ground this month.

🏆 TOP 3 LEADERS

  1. BBC (→ #1) retains the top position with a PX Index of 94, maintaining one of the most consistent user experiences in the sector. With 96% of users benefiting from fast loading and 99% experiencing stable layouts, the platform continues to deliver a highly reliable reading experience.

  2. The Guardian (→ #2) remains firmly in second place with a PX Index of 92, supported by strong loading performance and excellent interactivity, ensuring smooth access to content across devices.

  3. Independent (+3 → #3) enters the podium this month thanks to an improvement in responsiveness. Its INP metric now reaches the green threshold, meaning a larger share of readers benefit from smoother interactions while browsing articles.


🌟 NOTABLE IMPROVEMENTS
  • The Scottish Sun (+2 → #11) gains two places following an improvement in interactivity, with more users benefiting from smoother page interactions.

  • The Times (+2 → #17) records small but consistent improvements across all metrics, resulting in a gradual but visible progression in the ranking.

📉 CHALLENGES IN THE RANKINGS

  • Financial Times (–3 → #15) loses ground this month mainly due to competitive pressure and a slight decrease in loading performance, which impacted its relative position in the ranking.

  • The New York Times (–4 → #20) A more noticeable decline driven by a strong degradation in visual stability. The share of users experiencing a stable layout dropped by 15%, leaving only 59% of users with a good experience, compared to a near-green level previously.

WebsiteRankingRanking
M-1
PX
Index
LCP
(% Good)
INP
(% Good)
CLS
(% Good)
BBC1 (0)194968499
The Guardian2 (0)292969284
Independent3 (3)687937590
Gb News4 (1)587947388
Metro5 (-2)387897996


See the full ranking
WebsiteRankingRanking
M-1
PX
Index
LCP
(% Good)
INP
(% Good)
CLS
(% Good)
Sky Sports6 (-2)486858690
Racing Post7 (1)885858179
London South East8 (1)984877877
Telegraph9 (-2)784908086
Hello magazine10 (0)1084897973
The Scottish Sun11 (2)1382875690
Express12 (-1)1182856288
Standard13 (1)1481866781
Sporting Life14 (1)1581707397
Financial Times15 (-3)1281849586
Yahoo16 (1)1779837791
The times17 (2)1979848196
The Sun18 (0)1879845684
Birmingham Live19 (1)2078836173
Ny times20 (-4)1678818159
Daily Record21 (0)2176815875
Wales Online22 (1)2375825771
Daily Mail23 (1)2475855387
News Now24 (-2)2275736293
Echo25 (0)2572785573
Daily Star26 (1)2771805165
Manchester evening News27 (-1)2671765478
Good Read28 (0)2870798271
Live Score29 (0)2962654352
Premier League30 (0)3049425744

📊 Media experience overview

ux distribution medias


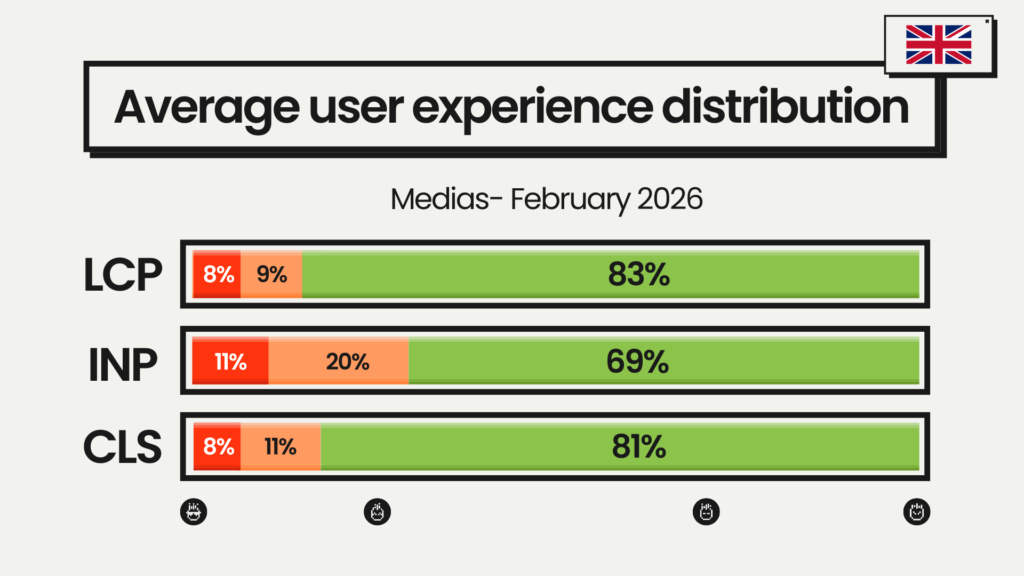
At sector level, media sites show strong fundamentals in loading performance, but responsiveness continues to be the main challenge.

On average:

  • PX Index: 79
  • 17% of users still experience slow loading (LCP outside the green threshold)
  • 30% encounter degraded interactions, highlighting persistent interactivity challenges
  • 19% experience layout instability, affecting reading comfort and navigation

Looking at threshold validation:

  • Only 7% of sites achieve a PX Index above 90
  • 33% of sites validate all three Core Web Vitals
  • 87% meet the loading threshold (LCP) (down from 90% last month)
  • 43% meet the interactivity threshold (INP)
  • 70% meet the stability threshold (CLS) (up from 66% last month)

👉 Key takeaway:
UK media sites are now largely fast to load, but interactivity remains the main limiter of user experience. In a sector where attention spans are short and switching between sources is effortless, improving responsiveness is becoming just as critical as editorial quality.


Travel : Webperf ranking of the top 30 most visited sites in the United Kingdom

The February ranking confirms a structural pattern: travel platforms still struggle to deliver consistently smooth user experiences, despite some encouraging progress among a few players.

Complex booking journeys, heavy search interfaces and dynamic content continue to make performance optimisation more challenging than in other sectors.


🏆 TOP 3 LEADERS

  1. Love Holidays (→ #1) retains the top position with a PX Index of 92, continuing to deliver the most balanced user experience in the sector. With 94% of users benefiting from fast loading, 88% smooth interactions, and 92% stable layouts, the platform remains one of the rare travel sites combining performance and reliability at scale.

  2. Transport for London (→ #2) keeps second place with a PX Index of 85. The platform stands out for its excellent interactivity, with 90% of users benefiting from responsive interactions, ensuring efficient access to transport information and route planning.

  3. Tripadvisor (→ #3) completes the podium once again with a PX Index of 83, offering solid loading performance and acceptable responsiveness despite complex content-heavy pages.


🌟 NOTABLE IMPROVEMENTS

  • Pitchup (+3 → #4) makes a significant leap thanks to a strong improvement in interactivity. The share of users benefiting from smooth interactions increases by 13%, allowing the site’s INP metric to reach the green threshold and bringing the platform closer to the podium.

  • Sykes Cottages (+7 → #14) One of the strongest improvements this month.The platform records +17% more users experiencing fast loading, +26% enjoying smooth interactions, and +22% benefiting from stable layouts, reflecting major optimisation efforts across the entire user journey.


📉 CHALLENGES IN THE RANKINGS

Cottages (–2 → #7) loses ground due to degradation in both loading performance and layout stability, impacting the consistency of the browsing experience.

Jet2 (–2 → #24) also records a decline in visual stability, affecting browsing comfort during booking flows.

Skyscanner (–7 → #21) One of the sharpest declines this month.
The platform records major regressions across all key metrics, with:

  • 17% more users experiencing slow loading,
  • 26% more facing degraded interactions,
  • 18% more encountering unstable layouts.

These changes significantly impact the perceived quality of the experience during search and comparison flows.


WebsiteRankingRanking
M-1
PX
Index
LCP
(% Good)
INP
(% Good)
CLS
(% Good)
Love Holidays1 (0)192948892
Transport For London2 (0)285879081
Trip Advisor3 (0)383887873
Pitchup4 (3)783837788
Trip5 (-1)482857787

See the full ranking
WebsiteRankingRanking
M-1
PX
Index
LCP
(% Good)
INP
(% Good)
CLS
(% Good)
Love Holidays1 (0)192948892
Transport For London2 (0)285879081
Trip Advisor3 (0)383887873
Pitchup4 (3)783837788
Trip5 (-1)482857787
Rome 2 Rio6 (0)680787188
Cottages7 (-2)580884388
Ryanair8 (0)879747976
Parkdean Resorts9 (0)979786881
National Express10 (0)1079886867
Po Cruises11 (0)1177787664
Agoda12 (1)1377914083
Vrbo13 (-1)1277807884
Skyes Cottages14 (7)2175817696
Hotels.com15 (0)1574697574
Eurostar16 (0)1671795065
Airbnb17 (0)1770695664
Uber18 (0)1869735594
Easy Jet19 (1)2068804359
The Trainline20 (-1)1968813664
Skyscanner21 (-7)1467644977
National Rail22 (1)2364793542
TUI23 (1)2464616851
Jet 224 (-2)2264773678
Booking25 (0)2560635793
Premier Inn26 (0)2658574966

📊 Travel experience overview

ux distribution travel


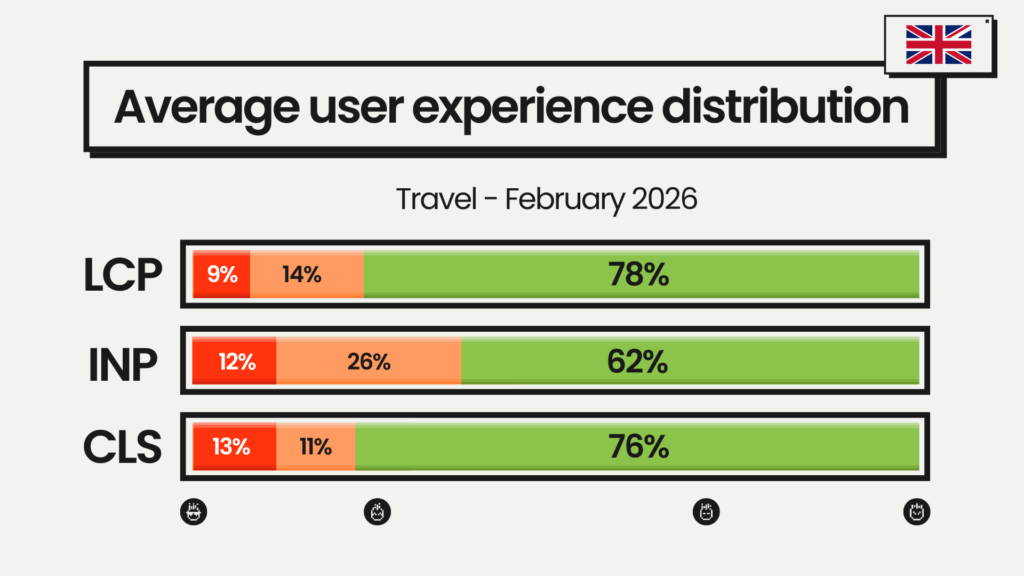
Travel continues to lag behind both e-commerce and media sectors, in terms of both maturity and consistency.

On average:

  • PX Index: 77
  • 22% of users experience slow loading (LCP outside the green threshold)
  • 27% encounter degraded interactions, highlighting persistent responsiveness issues
  • 24% experience unstable layouts, affecting navigation and booking flows

Threshold validation highlights the sector gap:

  • Only 4% of sites achieve a PX Index above 90
  • 23% of sites validate all three Core Web Vitals (up from 19% last month)
  • 69% meet the loading threshold (LCP)
  • 35% meet the interactivity threshold (INP) (up from 27% last month)
  • 58% meet the stability threshold (CLS) (down from 61% last month)

👉 Key takeaway:
Travel remains the least mature sector in terms of user experience. While several platforms are making targeted progress, interactivity continues to be the main bottleneck, and too many users still face friction during key moments of the booking journey. Reducing this friction will be essential for travel platforms looking to compete with more UX-mature sectors.


 Performance is no longer determined solely by a single technical value, but by the ability of websites to consistently deliver a good experience to the majority of users.

Reaching the “green” zone once is no longer enough.

The PX Index highlights a more demanding reality: true web performance is a capability, not a snapshot.

It requires:

  • Continuous monitoring of real-user experience, not lab metrics
  • The ability to detect early drifts before they impact large portions of the audience
  • Fast, repeatable execution to correct issues without slowing down business teams

In increasingly competitive environments, improving the percentage of users with a good experience means:

  • Less friction in critical journeys
  • Higher trust and engagement
  • Stronger SEO/ GEO signals
  • A durable competitive advantage

The sites that lead the rankings are not just faster : they are better organized to maintain performance over time.

And what better way to get started than with the help of web performance experts? Fasterize supports you in this process, with concrete solutions to make your website faster, more stable, and more responsive.

Where does your site stand in the UK webperf ranking?

Test your website’s performance in just 1 click with our new simulator. 

Run a full web performance diagnosis in minutes. See exactly how you stack up against the leaders in this ranking.

  1.  See the real share of users in the green
  2.  Benchmark your site against your industry

  3.  Get your Performance Index Score

  4.  Receive personalised recommendations

⭐ See you next month for a new update on the web experience of UK websites!

Sommaire
Test your site's performance in 1 click

Discover other articles…

beige blog banner

Is your brand really visible on Google and other search engines? Find out where you appear, who your competitors are, and how your visibility has

french ranking

We analysed real-user data from the top French websites to see who leads in speed, stability, and interactivity, and who still has work to do.

Agentic SEO for e-commerce

What is Agentic SEO? Understand how AI agents are transforming SEO execution and enabling e-commerce teams to move faster.

Boost your site speed now with EdgeSpeed!