


Have you already tried analysing your website’s performance? You can soon get lost in the intricacies of data and the multitude of tools. To help guide you, we are opening our webperf experts’ toolbox. We will share with you, free of charge, our favourite webperf analysis methods.
Browsers
Firefox and Chrome Dev Tools are, of course, essential tools for debugging what your browser does when it loads a page. They allow you to:
- see the initial source code and also the generated source code,
- inspect each request and filter by request type,
- carry out simple performance audits (or even complex audits with Lighthouse integrated into Chrome),
- see painting and frame rate problems, which is especially useful with large-scale web applications.
In the latest versions, Dev Tools also allows you to alter the source code of the page itself by reloading (see Chrome Dev tools – Local overrides)
They will be true allies for you when it comes to analysing your website’s performance.
WebPageTest
WebPageTest is an open source tool that has become a benchmark for webperf analysis. It allows you to carry out performance tests on any website and to vary the test conditions: device, connection type, place and even browser.

WebPageTest mainly generates very detailed waterfalls. It provides a representation of the elements loaded by the browser over time.
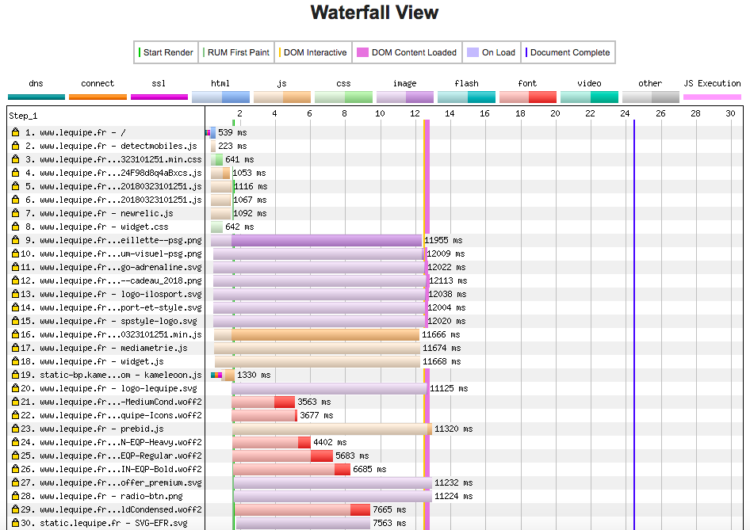
Waterfalls allow us to see all the elements being loaded and the way they behave. We can also very easily see the blocking elements for Start Render, the connection time, etc. A real gold mine!
Lastly, the tool provides additional but vital information:
- Does the tool use HTTP/2?
- Is it connected to a CDN?
- Are the images compressed?
- What does the CPU timeline look like?
- Which JS is used?
- At what point does the page become interactive?
Yellow Lab Tools
Yellow Lab is also an open source tool. It allows you to assess the complexity of a page. This could be called the “in-page” web performance: how is it constructed, is it made up of lots of CSS or JS, are the JS properly configured? And so on. The issues raised are very numerous indeed and very well documented. Incidentally, some are available only through this tool: JQuery loading, badly configured media queries, etc.
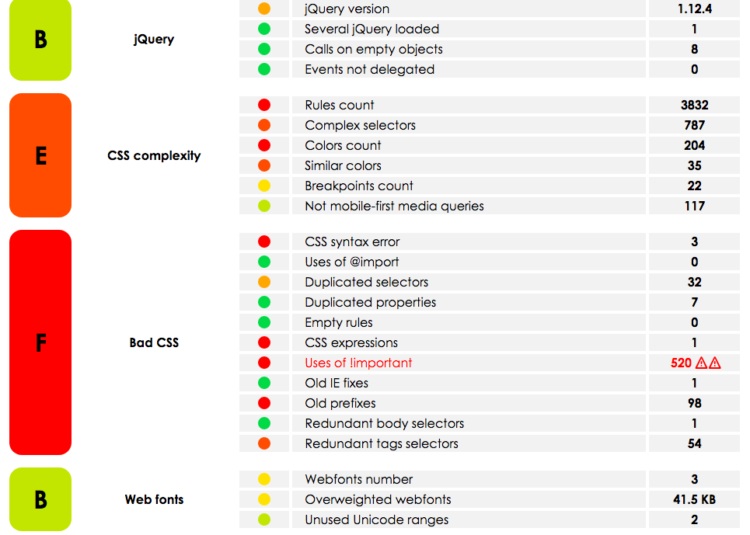
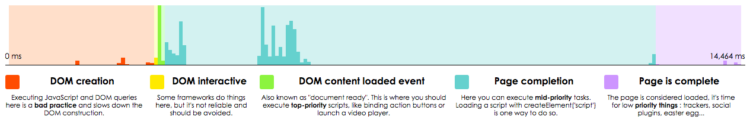
In addition, Yellow Lab provides a JS timeline and has the advantage of integrating the notion of interactivity with the user.
The tool is available online but it is also possible to run it locally.
Command lines
The command lines also provide their share of additional information in terms of performance. They allow you to find out more about the configuration of a given website.
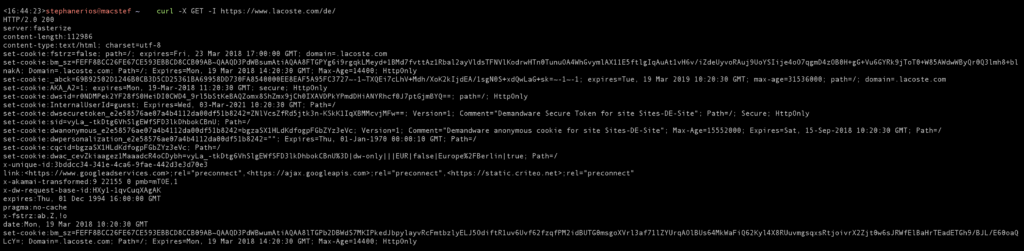
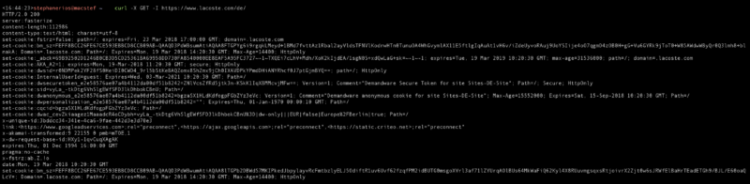
- curl, for example, allows you to make a query with certain parameters and to analyse the server’s response. By default, information returned in the headers is already of interest but becomes even more so when you know how to send the debug headers of certain CDNs.
- whois, traceroute and host provide information on hosting (by whom and where) and the CDN(s) (which CDNs are connected, how are they configured, etc.). For example, you can detect a possible poor configuration of the website’s CDN mapping.
SSL Labs
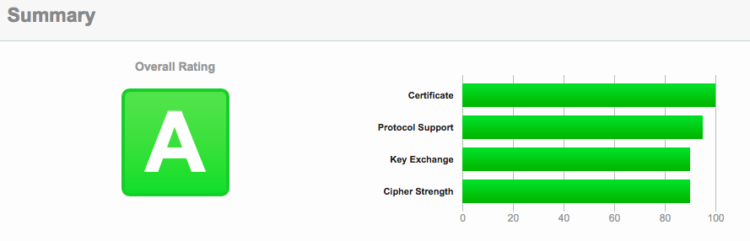
SSL Labs (which should in fact be called TLS Labs) allow you to check the TLS layer and find out if the “traditional” TLS optimisations have been activated: Session Resume, OCSP Stapling, TLS False Start, TLS 1.3, etc.
In addition to performance, the score given by the tool is a good indicator of this layer’s security (known SSL/TLS faults are taken into account in the score).
The Google Search Console
It is always worth having a look at the Google Search Console to see how the Google crawler behaves on the website.
Generally speaking, the faster the website, the more pages GoogleBot crawls.
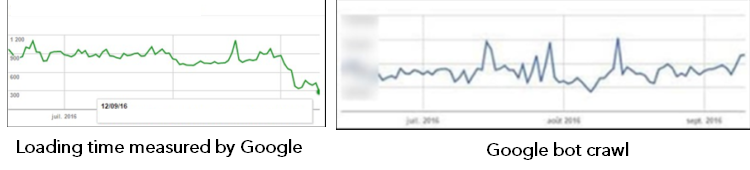
This gives a good indication of the servers’ response time (which can also be optimised for bots).
The Requestmap.webperf.tools
This tool is perfect for mapping Third Parties:
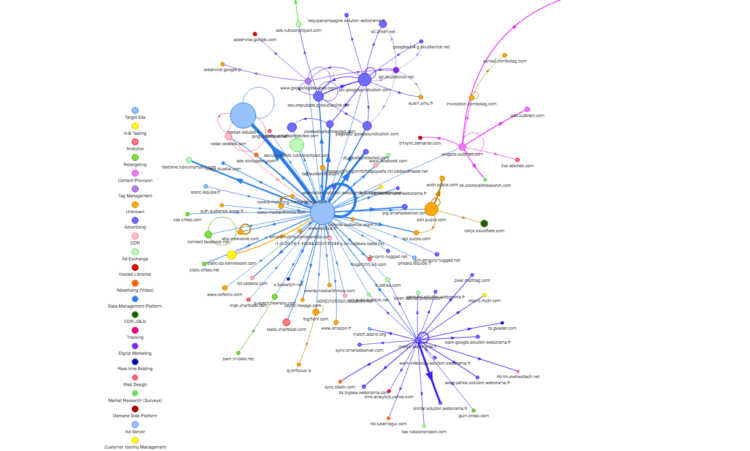
This mapping provides a visual image of the loading of all Third Parties. It illustrates all Third Parties loaded, which themselves lead to others. This provides a better understanding of the unchecked loading chain and data leakage.
In this way, you can make an inventory of your Third Parties and start a big spring-clean!
Bonus: Test My Site with Google
We are offering you this one as a bonus, as it does not enable you to carry out an audit, strictly speaking. Test My Site is a tool, provided by Google, which enables you to assess the business impact of your webperf. We investigated how it works and have explained it in detail in this article.
This is not an exact science, of course. We hope that these tools will give you a better understanding of your website’s page loading and enable you to carry out a more effective analysis of its performance.
If not, you can always ask Fasterize for a diagnosis and find out just what we can do for your website!