


Le Performance Experience Index (PX Index)
The PX Index is scored from 0 to 100 and measures the real share of users benefiting from a good experience on a website. It is based on real-world user data from the Chrome UX Report, and on all the key metrics that shape the user journey : from server response time to on-screen interactions.

The overall score is calculated as a weighted average of the percentage of users having a good experience, with each metric weighted according to its real impact on perceived performance:
The full methodology is detailed in this article.
📊 Top 50 — experience overview
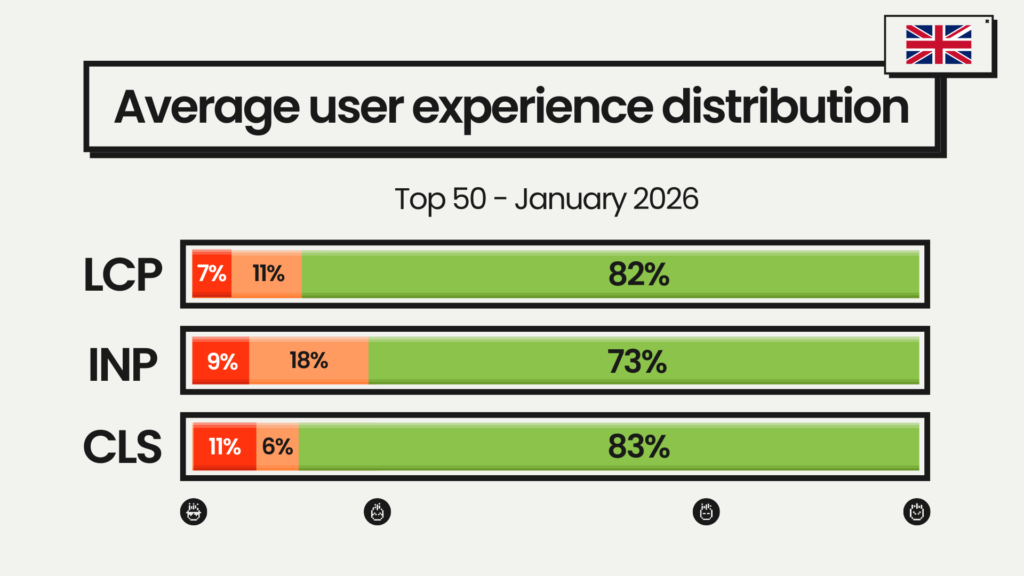
Across the Top 50, January highlights a market that is progressing, but unevenly.
On average:
- PX Index: 78
- 82% of users experience fast loading (LCP)
- 73% enjoy smooth interactions (INP)
- 83% benefit from stable layouts (CLS)
Looking at threshold validation:
- 14% of sites achieve a PX Index above 90
- 34% of sites validate all three Core Web Vitals
- 56% meet the interactivity (INP) threshold
- 80% maintain good visual stability (CLS)
Loading speed and layout stability are now largely under control for most major sites.
Interactivity remains the main differentiator, and the metric that most clearly separates leaders from the rest.
Here are the e-commerce rankings, for which web performance is a business and SEO issue.
E-commerce : Webperf ranking of the top 30 most visited sites in the United Kingdom
January is a key moment for e-commerce platforms.
After the festive rush and during winter sales, traffic remains high, but user expectations are even higher. Shoppers are less forgiving, journeys are shorter, and any friction directly impacts conversion.
This month’s ranking highlights a sector that is globally mature on loading speed, but still struggling to deliver consistently smooth interactions at scale.
🏆 TOP 3 – E COMMERCE LEADERS
- Ikea (→ #1)
remains the clear leader with a PX Index of 93, driven by a highly balanced experience.
With 95% of users benefiting from fast loading, 90% from smooth interactions, and 93% from stable layouts, the platform delivers a reassuring and fluid shopping journey despite its functional richness. - John Lewis (→ #2)
holds onto second place thanks to a robust and consistent experience.
High levels of loading performance and visual stability ensure trust and comfort, while interactivity remains solid for the majority of users. - Pretty Little Thing (→ #3)
Still on the podium, Pretty Little Thing confirms its strong execution, but the INP must be monitored and optimised to remain leaders
🌟 NOTABLE IMPROVEMENTS
- Temu (+7 → #7)
One of the strongest progressions this month.
Temu significantly increases the share of users having a good experience, with more users in the green on both loading (LCP) and interactivity (INP) : making the site feel faster and more responsive throughout the journey. - JD Sports (+3 → #16)
A well-rounded improvement across all metrics:
+2% of users experience fast loading, +5% enjoy smoother interactions, and +2% benefit from better visual stability. These gains directly support high-engagement shopping flows.
📉 CHALLENGES IN THE RANKINGS
- ASOS (–3 → #13)
loses ground following a slight decline across all experience metrics.
While the experience remains broadly acceptable, even small regressions are enough to impact ranking in a highly competitive top tier. - Shein (–4 → #26)
records a more visible setback, with 7% of users now experiencing degraded interactivity (INP). This loss of responsiveness introduces friction in browsing and selection : a critical risk for conversion-driven platforms.
📊 E-commerce experience overview
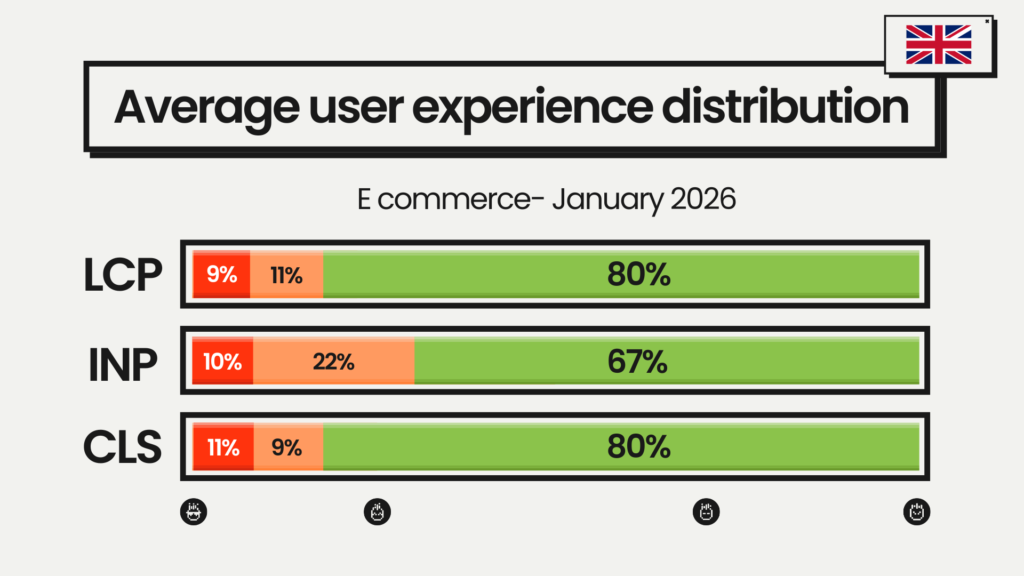
At sector level, e-commerce shows solid foundations, but clear room for improvement on interactivity.
On average:
- PX Index: 76
- 80% of users experience fast loading (LCP)
- 67% benefit from smooth interactions (INP)
- 80% enjoy stable layouts (CLS)
Threshold validation reveals the gaps:
- 10% of sites reach a PX Index above 90
- 36% of sites validate all three Core Web Vitals
- 73% meet the loading threshold (LCP)
- 43% meet the interactivity threshold (INP)
- 80% meet the stability threshold (CLS)
Most e-commerce sites now load fast and remain visually stable, but interactivity is still the main bottleneck. Improving how quickly pages respond to user actions is now the clearest lever to stand out, reduce friction, and protect conversion during high-pressure periods like sales.
Media : Webperf ranking of the top 30 most visited sites in the United Kingdom
News publishers head into the end-of-year with mixed results. While loading performance remains strong across the board, interactivity continues to be a sticking point.
🏆 TOP 3 LEADERS
- BBC (→ #1) takes the top spot with a PX Index of 94, driven by a highly controlled experience. With 96% of users benefiting from fast loading, 85% from smooth interactions, and 98% from stable layouts, the platform delivers a reading experience that feels both immediate and reliable.
- The Guardian (→ #2) remains firmly in second place, supported by excellent loading performance and strong interactivity. The main challenge lies in visual stability, where a smaller share of users experience minor layout shifts : an area that still limits its PX Index potential.
- Metro (+3 → #3) enters the podium this month thanks to a clear improvement in loading experience. More users now access content quickly, reinforcing the feeling of immediacy that is critical for high-frequency news consumption.
🌟 NOTABLE IMPROVEMENTS
- Express (+5 → #11)
A meaningful progression driven by interactivity. Express increases the share of users enjoying smooth interactions, with +2% of users now experiencing a good INP, reducing friction during navigation and article browsing. - Standard (+3 → #14)
The Standard records small but consistent optimisations across its experience metrics, enough to translate into a visible ranking gain in a very tight mid-table.
📉 CHALLENGES IN THE RANKINGS
- The New York Times (–3 → #16)
A decline linked to reduced visual stability, with 12% more users experiencing layout shifts. For content-heavy pages, this instability directly affects reading comfort and perceived quality. - The Sun (–6 → #18)
One of the sharpest drops this month. The site sees +6% more users facing degraded interactivity and +3% experiencing poorer layout stability, creating noticeable friction in fast-paced browsing contexts.
📊 Media experience overview
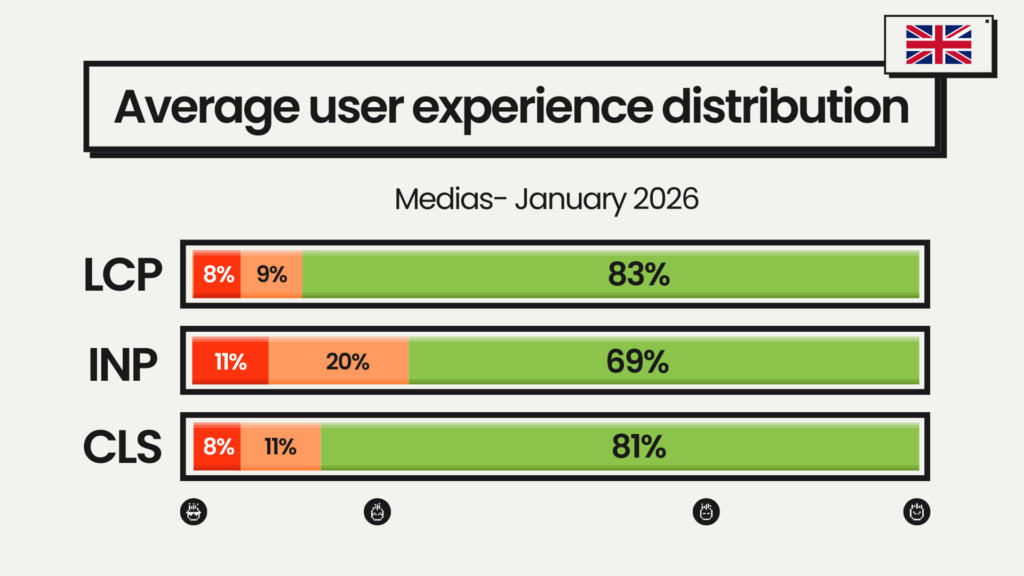
At sector level, media sites show strong fundamentals on loading speed, but interactivity remains a structural weakness.
On average:
- PX Index: 79
- 83% of users experience fast loading (LCP)
- 69% enjoy smooth interactions (INP)
- 81% benefit from stable layouts (CLS)
Threshold validation highlights the imbalance:
- 6% of sites reach a PX Index above 90
- 33% of sites validate all three Core Web Vitals
- 90% meet the loading threshold (LCP)
- 43% meet the interactivity threshold (INP)
- 66% meet the stability threshold (CLS)
Key takeaway:
UK media sites are now largely fast to load, but interactivity remains the main limiter of user experience. In an environment where attention is scarce and switching costs are low, improving responsiveness is becoming just as critical as editorial quality.
Travel : Webperf ranking of the top 30 most visited sites in the United Kingdom
January is a critical month for the travel sector. Post-holiday planning, winter breaks and early bookings put heavy pressure on search, comparison and booking journeys, often on mobile and in sub-optimal network conditions.
This month’s ranking confirms a structural reality: Travel remains the most challenging vertical in terms of user experience, with complex flows, data-heavy pages and interactivity still difficult to stabilise at scale.
🏆 TOP 3 LEADERS
- Love Holidays (→ #1) keeps the top position with a PX Index of 92, the highest in the sector. The platform delivers a well-balanced experience, with 94% of users enjoying fast loading, 89% smooth interactions, and 92% stable layouts ; a rare level of consistency for travel booking journeys.
- Transport for London (→ #2) secures second place thanks to excellent interactivity, with 90% of users benefiting from responsive interactions.
Loading performance remains solid, but visual stability is slightly more fragile, which still limits overall experience perception. - Tripadvisor (→ #3) completes the podium with a robust but uneven experience. While loading remains efficient for most users, interactivity and layout stability still affect a significant share of sessions, especially on content-rich comparison pages.
🌟 NOTABLE IMPROVEMENTS
- Parkdean Resorts (+4 → #9)
One of the strongest progressions this month. The site records +5% more users with good loading experience (LCP) and +6% enjoying stable layouts (CLS), reinforcing confidence during browsing and accommodation selection. - Airbnb (+3 → #17)
Airbnb gains three places thanks to a clear improvement in loading performance, with +7% more users accessing content quickly. This improvement directly benefits discovery and search flows, where first impressions are critical.
📉 CHALLENGES IN THE RANKINGS
- Agoda (–3 → #13)
A slight decline linked to reduced visual stability.
More users now experience layout shifts, which can disrupt trust and readability during price and availability checks. - EasyJet (–3 → #20)
EasyJet loses ground due to a degradation in visual stability, with +3% more users experiencing unstable layouts : a sensitive issue in booking and check-in flows.
 Travel experience overview
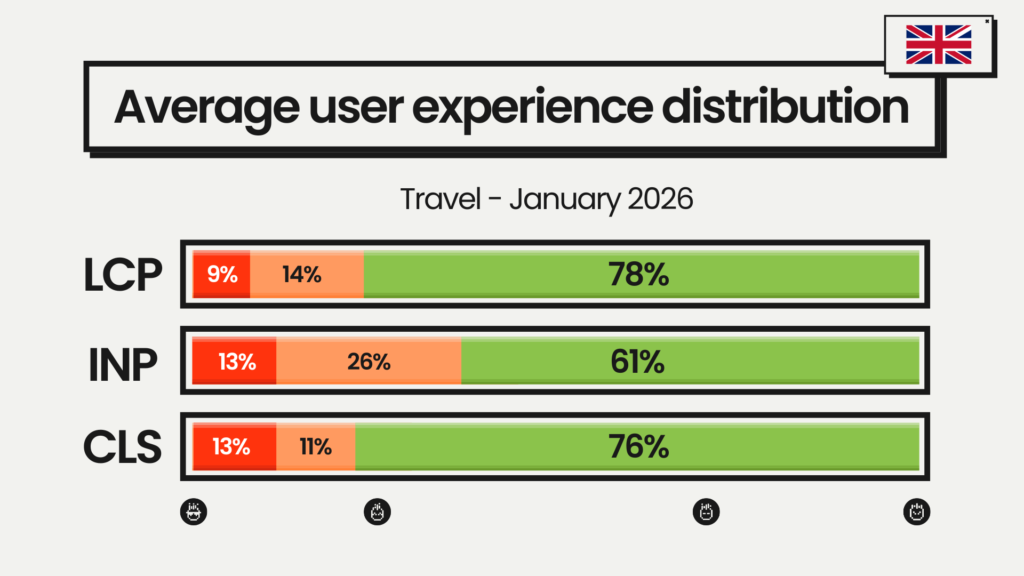
Travel clearly lags behind e-commerce and media, both in maturity and consistency.
On average:
- PX Index: 77
- 78% of users experience fast loading (LCP)
- 61% benefit from smooth interactions (INP)
- 76% enjoy stable layouts (CLS)
Threshold validation highlights the gap:
- 4% of sites reach a PX Index above 90
- 19% validate all three Core Web Vitals
- 69% meet the loading threshold (LCP)
- 27% meet the interactivity threshold (INP)
- 61% meet the stability threshold (CLS)
Travel remains the least mature sector in terms of user experience.
While some platforms are making targeted progress, interactivity is still the main blocker, and too many users continue to face friction at key moments of the booking journey. Bridging this gap will be decisive to compete with more UX-mature verticals.


