


Cumulative Layout Shift (CLS): what is it?
Cumulative Layout Shift (CLS) is a Core Web Vitals metric supported by Google Lighthouse ‘s Pagespeed insights , which is a user-centric metric that helps assess the visual stability of a web page. It measures how often users experience unexpected layout shifts. Thus, a low CLS indicates that the page is stable and provides a quality user experience.
You’ve probably started reading an article online, and suddenly the text moves and you lose track. Or worse, you’re about to click on a link or button, but the moment you want to click, the content moves and you click somewhere else. These experiences are annoying at best, and damaging at worst – as seen in this video:
Unexpected content movement usually occurs because resources are loaded asynchronously, or DOM elements are dynamically added to the page on top of existing content.
What’s causing these movements? It could be an image or video with unknown dimensions, a font that appears larger or smaller than the unstyled version of the text, or a third-party ad or widget that dynamically resizes itself.
Unfortunately, these phenomena cannot always be anticipated in a development environment because it is often very different from what users perceive in production. Custom or third-party content often does not behave the same way between these two environments, test images are often already in the developer’s browser cache, and API calls that run locally are often so fast that the delay is not noticeable. But then, how can we assess the perception of stability of a web page?
Cumulative Layout Shift (CLS) helps address this issue by measuring the frequency with which changes occur on Internet users’ screens.
What is Cumulative Layout Shift (CLS)? Definition.
CLS measures the sum total of all layout shift scores (or Layout Shift scores , which are calculated here ), accumulating every unexpected layout shift that occurs over the entire lifetime of the page.
A layout change occurs whenever a visible element changes position.
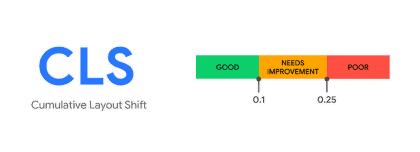
What is a good Cumulative Layout Shift?
For a good user experience, CLS should be less than 0.1. To ensure you achieve this goal for most of your users, Google recommends considering the 75th percentile of page load times, for both mobile and desktop devices .
What is a Layout Shift ?
Layout Shifts are defined by Layout Instability API which reports layout-shift occurrences whenever a visible element in the viewport changes from its starting position (e.g. top-left in default writing mode) between two rendered frames . These elements are then considered unstable elements.
Note that Layout Shifts only occur when existing elements change their starting position. If a new element is added to the DOM or an existing element changes size, this does not count as a Layout Shift – as long as this change does not change the starting position of other visible elements.
The Layout Shift score
To calculate the Layout Shift score , the browser looks at the size of the viewport and the movement of unstable elements within the viewport between two rendered frames . The Layout Shift score is the product of two measures of this movement: Impact Fraction and Impact Distance (both defined below).
layout shift score = impact fraction * distance fraction
Impact Fraction
The Impact Fraction metric allows you to observe unstable elements in the viewport between two frames.
The sum of the visible areas of all unstable elements from the previous frame and the current frame , as a fraction of the total window area, is called the Impact Fraction of the current frame .
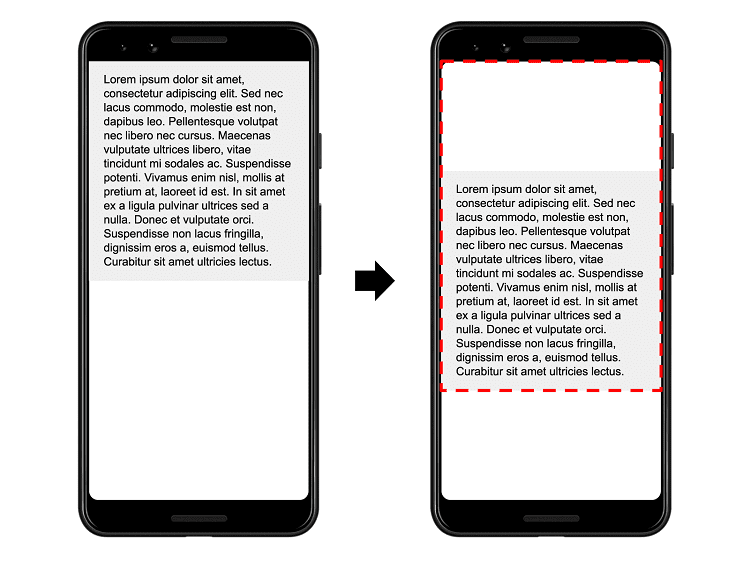
In the image above, we see an element that takes up half the screen in one frame. Then, the element is scaled down by 25% relative to the viewport size . The red dotted rectangle indicates the cumulative visible area of the element in both frames , which in this case is 75% of the viewport . Its Impact Fraction is therefore 0.75.
Distance Fraction
The other component of the Layout Shift score calculation is to evaluate the distance that unstable elements have moved within the viewport. Distance Fraction is the greatest distance that an unstable element has moved within the frame (horizontally or vertically) divided by the largest dimension of the viewport (width or height, whichever is greater).
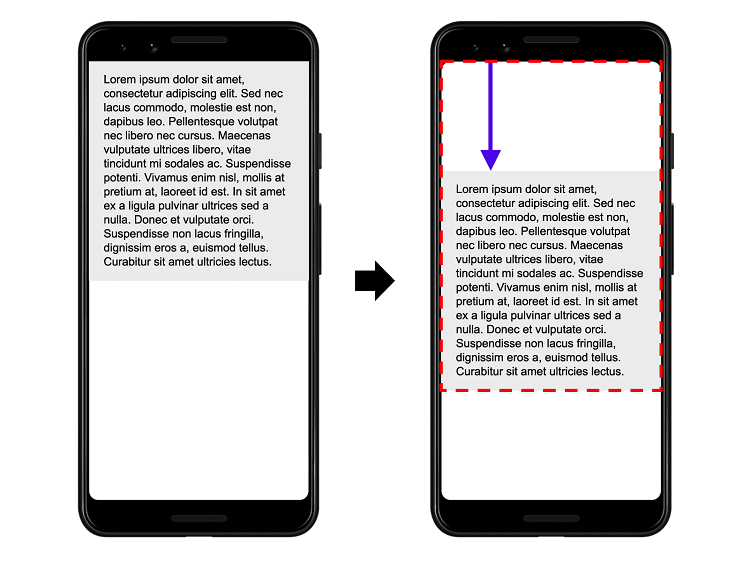
In the example above, the greatest distance traveled by the unstable element is a maximum displacement of 25% in height in the window. The Distance Fraction is therefore 0.25.
In sum, in this example, the Impact Fraction is 0.75 and the Distance Fraction is 0.25, which makes the Layout Shift score 0.75 * 0.25 = 0.1875.
NB: Initially, the Layout Shift score was calculated based on the Impact Fraction only . Distance Fraction was introduced to avoid penalizing cases where large elements move slightly.
The following example illustrates how adding content to an existing element affects the Layout Shift score :
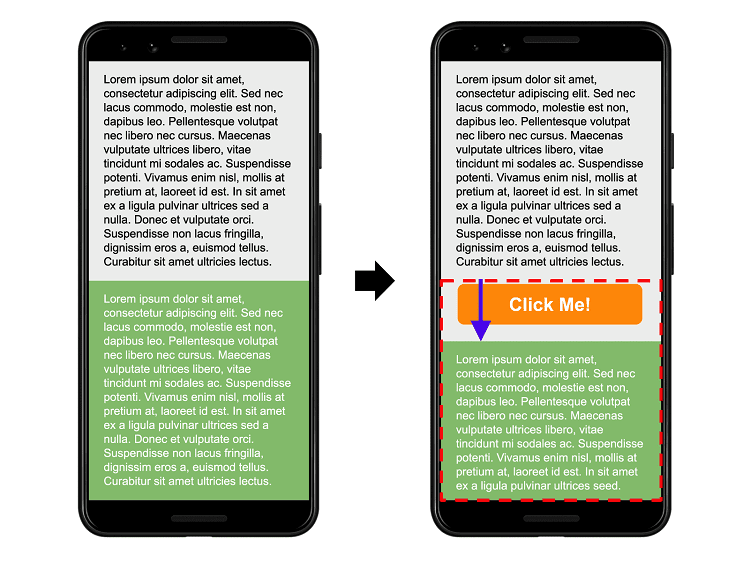
We see that the ” Click Me! ” button is added below the gray block with black text, which pushes the green block with white text down (and partially out of the window).
In this example, the gray area changes size, but its starting position does not change, so it is not an unstable element.
The ” Click Me! ” button was not in the DOM to begin with, so there is no position change for that element either.
The starting position of the green block changes, however, but since it has been moved partially out of the window, the invisible area is not taken into account when calculating the Impact Fraction . The cumulative visible areas of the green block in both frames (shown by the dotted red rectangle) is the same as the area of the green block in the first frame, which is 50% of the window. The Impact Fraction is therefore 0.5.
Distance Fraction is illustrated by the purple arrow. The green block is moved down about 14% in the window, so the Distance Fraction is 0.14.
The Layout Shift score is 0.5 x 0.14 = 0.07.
Now let’s see what happens when multiple elements are unstable in the example below:
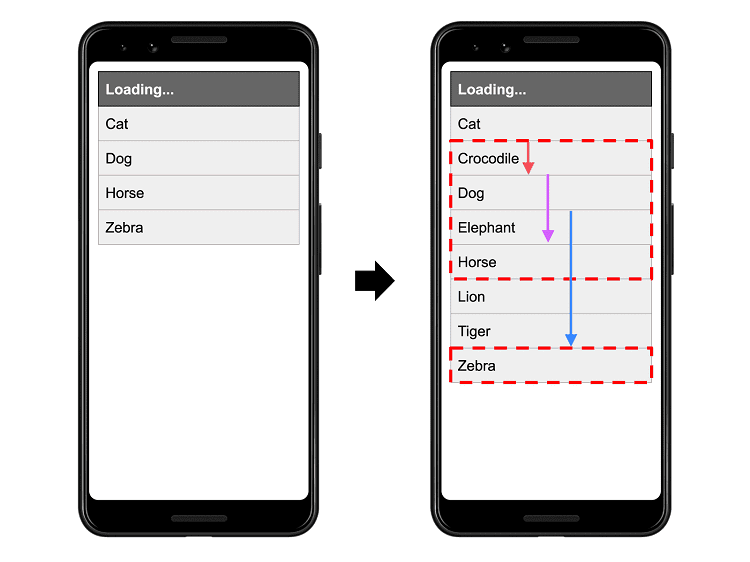
In the first frame above, there are four results of an API call for different animals, sorted alphabetically. In the 2nd frame , results are added to the sorted list.
The first element in the list (” Cat “) does not change its starting position between frames, so it is stable. New elements added to the list were not originally in the DOM, so their starting positions do not change either. But the elements ” Dog “, ” Horse “, and ” Zebra ” all change their starting positions, making them unstable elements.
Again, the dotted red rectangles represent the cumulative of these three unstable areas before and after, which in this case represents about 38% of the viewport ( Impact Fraction = 0.38).
The arrows represent the distances that the unstable elements have moved from their starting positions. ” Zebra “, represented by the blue arrow, has moved the most, by about 30% of the window height. Its Distance Fraction is therefore 0.3.
The Layout Shift score for this example is 0.38 x 0.3 = 0.1172.
CLS score calculation: a maximum session window capped at 5 seconds
Note: In April 2021, Google changed the way CLS is calculated. It is performed over a maximum session window with a 1-second interval, capped at 5 seconds.
Visualizing layout changes for calculating Cumulative Layout Shift
In the example above, different layout changes occur over time as the user views the page. Each is represented by a blue bar. Here we see that the blue bars have different heights, which represent the score of each layout change.
A session window starts with the first layout change and continues to expand until there is a gap without a layout change. On the next layout change, a new session window starts. There are 3 gaps without a layout change, and thus 3 session windows in this example. As expected in the CLS definition, the scores of each layout change are added together, so that each window’s score is the sum of its individual layout changes.
However… in the example below, we observe only one small layout change in the 2nd session window, with a very low score. This means that the average score is quite low.
But what if the developer fixes this small layout shift? The score is then calculated only on session window 1, which means that the page score almost doubles. It would be discouraging for a developer to improve layout shifts, only to find that the score has deteriorated. And removing this small layout shift would obviously make the user experience slightly better, so it should not degrade the score, quite the opposite.

So, to overcome the problem of CLS score averages being generated from layout changes, Google decided to measure these scores over smaller, capped maximum viewports. As a result, in the example above, session viewport #2 is ignored, and only the sum of layout changes in session viewport 1 is reported.
Expected and Unexpected Layout Shifts
Note that not all layout changes are bad. Indeed, many dynamic web applications frequently change the initial position of elements on a page.
User-initiated Layout Shifts
A layout shift is only bad if the user doesn’t expect it. On the other hand, layout shifts that occur in response to user interactions (clicking a link, pressing a button, typing in a search box, and similar…) are acceptable and accepted as long as the shift occurs as a result of an interaction and the effect is obvious to the user.
For example, if an interaction triggers a network request that takes a while, it’s best to immediately create space on the page to display a loading indicator, to avoid an unpleasant layout change at the end of the request. If the user doesn’t realize that something is loading, or doesn’t know when the resource will be ready, they may try to click on something else in the meantime – something that might get inserted from underneath, creating an unintuitive and frustrating experience.
Be aware that the hadRecentInput flag is for Layout Shifts that occur within 500 milliseconds of an interaction, so they are excluded from the calculations.
Animations and transitions
Animations and transitions, when done well, are a great way to update page content without any surprises. Content that suddenly and unexpectedly moves across the page almost always results in a poor user experience. But content that moves gradually and naturally can often help to better understand what’s happening and guide the user between changes.
For this purpose, the CSS transform property allows you to animate elements without triggering a layout change:
- Instead of changing the height and width properties, use transform: scale() instead.
- To move elements, avoid changing the top, right, bottom, or left properties, use transform: translate() instead.
How to measure Cumulative Layout Shift
Cumulative Layout Shift is measured using Google’s Lab or Field tools , and is available in the following tools:
FIELD TOOLS (REAL USER MONITORING)
LAB TOOLS (SYNTHETIC MONITORING)
Caution: Lab (Synthetic Monitoring) tools typically load pages in a synthetic environment, and therefore do not measure layout changes that occur in real-world conditions. As a result, the CLS values reported by Lab tools for a given page may be lower than what real users experience.
MEASURING THE CUMULATIVE LAYOUT SHIFT IN JAVASCRIPT
The easiest way to measure CLS (as well as all Core Web Vitals Field metrics ) is with the web-vitals JavaScript library, which simplifies manual CLS measurement into a single function:
					import {getCLS} from 'web-vitals';
// Measure and log the current CLS value,
// any time it's ready to be reported.
getCLS(console.log);
To measure CLS manually, you can use the Layout Instability API. The example below shows how to create a PerformanceObserver to catch layout-shift occurrences and log them to the console:
					// Use a try/catch instead of feature detecting `layout-shift`
// support, since some browsers throw when using the new `type` option.
// https://bugs.webkit.org/show_bug.cgi?id=209216
try {
 const po = new PerformanceObserver((list) => {
   for (const entry of list.getEntries()) {
     console.log(entry);
   }
 });
 po.observe({type: 'layout-shift', buffered: true});
} catch (e) {
 // Do nothing if the browser doesn't support this API.
}
The CLS is thus the sum of these individual layout-shift occurrences that did not arise from a recent user action. To calculate CLS, one must declare a variable that stores the recent score, and then increment it each time a new unexpected layout shift is detected.
Rather than reporting every CLS change (which can happen very frequently), it is better to keep track of the recent CLS value and report it every time the lifecycle state changes to hidden :
					// Sends the passed data to an analytics endpoint. This code
// uses `/analytics`; you can replace it with your own URL.
function sendToAnalytics(data) {
 const body = JSON.stringify(data);
 // Use `navigator.sendBeacon()` if available, falling back to `fetch()`.
 (navigator.sendBeacon && navigator.sendBeacon('/analytics', body)) ||
     fetch('/analytics', {body, method: 'POST', keepalive: true});
}
// Use a try/catch instead of feature detecting `layout-shift`
// support, since some browsers throw when using the new `type` option.
// https://bugs.webkit.org/show_bug.cgi?id=209216
try {
 // Store the current layout shift score for the page.
 let cls = 0;
 function onLayoutShiftEntry(entry) {
   // Only count layout shifts without recent user input.
   if (!entry.hadRecentInput) {
     cls += entry.value;
   }
 }
 // Create a PerformanceObserver that calls `onLayoutShiftEntry` for each entry.
 const po = new PerformanceObserver((entryList) => {
   entryList.getEntries().forEach(onLayoutShiftEntry);
 });
 // Observe entries of type `layout-shift`, including buffered entries,
 // i.e. entries that occurred before calling `observe()` below.
 po.observe({
   type: 'layout-shift',
   buffered: true,
 });
 // Log the current CLS score any time the
 // page's lifecycle state changes to hidden.
 document.addEventListener('visibilitychange', () => {
   if (document.visibilityState === 'hidden') {
     // Force any pending records to be dispatched.
     po.takeRecords().forEach(onLayoutShiftEntry);
     // Report the CLS value to an analytics endpoint.
     sendToAnalytics({cls});
   }
 });
} catch (e) {
 // Do nothing if the browser doesn't support this API.
}
WHY IS THE CUMULATIVE LAYOUT SHIFT DIFFERENT BETWEEN LAB AND FIELD DATA ON PAGESPEED INSIGHTS?
The effects of user interactions on CLS
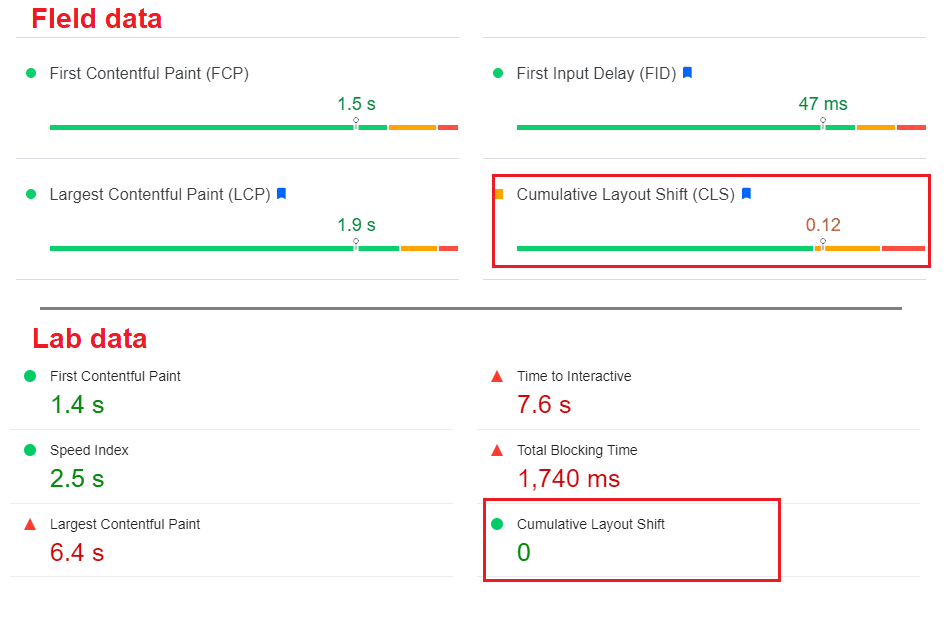
The CLS score measured with Lab data only considers layout changes that occur above the fold and during loading, but this is only a subset of what CLS actually measures.
In the field, with real users, CLS accounts for all unexpected layout shifts that occur throughout the lifetime of that page, including elements that move as the user scrolls, or in response to slow network requests after user interaction.
For example, it’s quite common for pages to lazyload images or iframes without dimensions, which can cause layout changes as the user scrolls through sections of the page. But these changes can only happen if the user scrolls down the page, which is often not detected by Lab data.
Personalized content
Personalized content – including targeted ads and A/B testing – affects which elements are loaded on a page. It also affects how they are loaded, as personalized content is often loaded later and inserted into the main content, resulting in layout changes.
To pull up Lab data, a page is typically loaded either without personalized content or with content aimed at a generic “test user,” which may or may not trigger the changes that real users see.
Since field data includes the experiences of all users, the amount (and degree) of layout shifts observed on a given page depends heavily on the content loaded.
The effects of cache state and bfcache on CLS
Two of the most common causes of layout shifts during loading are images and iframes without dimensions (as mentioned above), and slow-loading web fonts. Both of these issues are most likely to affect the experience when a user first visits a site, when its cache is clear.
If a page’s resources are cached, or the page itself is retrieved from the bfcache , the browser can usually display images and fonts immediately, without waiting for them to be downloaded. This can result in lower CLS values in the field than those reported by a lab tool.
Field or Lab: which metrics should be prioritized to optimize CLS?
Generally speaking, if you have both Field and Lab data for your web pages, Field data is the best way to prioritize your efforts. Since Field data represents what real users experience, it’s the most accurate way to truly understand what’s causing problems for your users and what needs to be optimized.
However, if your Field data is good overall, but your Lab data shows that there is still room for improvement, it’s worth digging deeper to understand what additional optimizations can be made.
How to improve CLS
For most websites, you can avoid unexpected layout shifts by following a few key principles:
- To optimize your images , always provide size attributes on your images and video elements, or reserve the required space, for example with CSS aspect ratio boxes. This technique ensures that the browser can allocate sufficient space while the image is loading. Note that you can also use unsized-media feature policy to force this behavior in browsers that support them.
- Never insert content on top of existing content unless in response to user interaction. This ensures that any layout changes that occur are expected.
- Prefer transformation animations over property animations that trigger changes in the layout of elements on a page . Animate transitions in a way that provides context and continuity from one state to the next.
Finally, to go further on the techniques for improving Cumulative Layout Shift, you can check out the following talk by Annie Sullivan at #PerfMatters (2020): Understanding Cumulative Layout Shift .
Follow the developments of the Cumulative Layout Shift
Google fixes and evolves the APIs used to measure metrics, as well as the definition of the metrics themselves. These changes may appear as improvements or regressions in your internal reports and dashboards. To help you keep track of these changes, the changes are logged in this CHANGELOG .
Want to explore the topic in video? The replay of our webinar dedicated to CLS is here:
Would you like to deepen your knowledge of
webperf metrics? Discover our white paper:
“Decipher and improve your webperf”

