french ranking

Ranking: the user experience of the most visited sites in France!

Sommaire

It’s time to dive into the user experience ranking of the most visited websites in France.


For over a decade, we’ve analysed the performance of the most visited French websites every month. These rankings, based on data from the Chrome User Experience Report (CrUX) and Google’s Core Web Vitals, have become a benchmark for assessing market maturity in terms of user experience.

Until now, websites were ranked based on a score derived from their compliance with Google’s recommended thresholds. This framework helped structure market priorities and widely contributed to the democratisation of web performance.

But over time, a key limitation has emerged: a website can meet all the Core Web Vitals thresholds while still delivering a poor experience to a significant portion of its audience.


At Fasterize, we’ve chosen to put users back at the heart of measurement. Performance can no longer be assessed solely as technical compliance, but must reflect the real-world experience users have throughout their journey.

This belief led us to evolve our historical scoring method into the Performance Experience Index (PX Index). As of January 2026, all our rankings are now based on the PX Index.

The Performance Experience Index (PX Index)

The PX Index is scored from 0 to 100 and measures the real share of users benefiting from a good experience on a website. It is based on real-world user data from the Chrome UX Report, and on all the key metrics that shape the user journey : from server response time to on-screen interactions.

The overall score is calculated as a weighted average of the percentage of users having a good experience, with each metric weighted according to its real impact on perceived performance:

  • LCP represents 30%
  • CLS represents 20%
  • INP represents 20%
  • FCP represents 15%
  • TTFB represents 15%

The full methodology is detailed in this article.

🤖 Summarize this article with :

With this new methodology, the rankings offer a new lens.

We no longer focus solely on the 75th percentile values of each metric to determine whether a site “passes the thresholds”, but instead display the percentage of users having a good experience, in other words, those exceeding the threshold.

A percentage of 75% or more means that the metric meets Google’s “Good” threshold, as over 75% of users are experiencing a high-quality visit.

Each month, we analyze the mobile web performance of:

✅ The 50 most visited websites in France
🛒 The top 30 e-commerce platforms
📰 The top 20 media outlets
✈️ The 20 leading travel websites

Let’s dive into the February 2025 leaderboard.


Web Performance ranking: France’s 50 most visited sites

🏆 TOP 3: WHO’S LEADING THE PACK?

  1. 🥇 impots.gouv.fr retains first place with a PX Index of 94. The site continues to demonstrate remarkable control of the Core Web Vitals, with a very large majority of users benefiting from a fast, stable and smooth experience.
  2. 🥈 Leroy Merlin remains firmly in second place (PX Index 92). The platform confirms its maturity in web performance, delivering a consistent experience for the vast majority of its visitors.
  3. 🥉 Assurance Maladie once again completes the podium (PX Index 92). The site maintains excellent overall stability and continues to offer a reliable experience to its users.

The stability of this top trio shows that sustainable performance above all relies on the consistency of optimisation efforts over time.


📈 BIGGEST IMPROVEMENTS IN THE TOP 50

Several sites gained positions thanks to an increase in the share of users benefiting from a good experience, particularly in terms of visual stability.

  • Free (6th, +14): the strongest progression this month, driven by a clear improvement in CLS, with +15% more users benefiting from good visual stability. The site therefore strengthens the overall fluidity of the experience.
  • 20 Minutes (13th, +5): the site progresses thanks to a notable improvement in page stability, with +10% more users now in the green for CLS, improving reading comfort.
  • L’Équipe (15th, +4): the site confirms the positive momentum observed in recent months and continues to climb the ranking thanks to a better distribution of users in the green across key metrics.

These gains prove that even seemingly minor improvements can have a major impact. They reflect sustained optimisation efforts — particularly around Interaction to Next Paint (INP). Remember: good FID doesn’t guarantee good INP. FID only measures the first interaction, whereas INP evaluates responsiveness across the entire session.


🔻 FALLING BACK

Conversely, some players moved down the ranking this month, often due to a drop in the proportion of users benefiting from an optimal experience.

  • Ministère de l’Intérieur (11th, −5): the site recorded a notable decline in visual stability, with −13% of users in the green for CLS, directly impacting its ranking.
  • Le Parisien (18th, −4): a slight deterioration in user experience leads to a drop in a very tight ranking.
  • Le Figaro (21st, −4): the site loses several places in a context where several competitors are progressing more quickly.
  • SFR (28th, −5): the drop is mainly linked to a deterioration in interactivity and stability, with +14% of users now experiencing a poor experience on INP and +9% of users moving into the orange zone on CLS.

These developments are a reminder that web performance remains a fragile balance, where user experience must be continuously monitored and optimised. Without ongoing attention, the risk of regression is high.

WebsiteRankingRanking
M-1
PX
Index
LCP
(% Good)
INP
(% Good)
CLS
(% Good)
impots.gouv.fr1 (0)194959298
Leroy Merlin2 (0)292948893
Assurance Maladie3 (0)392949496
Cdiscount4 (1)591988194
BFM TV5 (-1)491928788

See the full ranking
WebsiteRankingRanking
M-1
PX
Index
LCP
(% Good)
INP
(% Good)
CLS
(% Good)
impots.gouv.fr1 (0)194959298
Leroy Merlin2 (0)292948893
Assurance Maladie3 (0)392949496
Cdiscount4 (1)591988194
BFM TV5 (-1)491928788
Free6 (14)2090889290
Google7 (2)989927796
Franceinfo8 (-1)789878995
La Redoute9 (-1)889947796
Actu.fr10 (0)1089937791
Ministere de l’Intérieur11 (-5)688899285
Bing12 (-1)1188908091
20 Minutes13 (5)1888878194
Le Monde14 (-2)1288938877
L’Équipe15 (4)1987917784
AliExpress16 (-3)1387898489
Gala17 (-2)1587947284
Le Parisien18 (-4)1487877792
eBay19 (-3)1686867996
Ouest France20 (1)2185937679
Le Figaro21 (-4)1785956679
Service-Public.fr22 (3)2585828395
Amazon23 (-1)2285918079
Le Journal des Femmes24 (0)2485867384
Tele Loisirs25 (3)2884876695
But26 (1)2784907479
Voici27 (-1)2683876093
SFR28 (-5)2383887185
PagesJaunes29 (0)2982849078
Linternaute.com30 (2)3282856780
Marmiton31 (0)3181786889
Femme Actuelle32 (-2)3080835892
Boulanger33 (1)3478877686
E.Leclerc34 (1)3577797960
Credit Agricole35 (1)3676778061
Orange36 (-3)3376757278
Yahoo37 (1)3875826295
Vinted38 (2)4073746590
Carrefour39 (-2)3773796946
Facebook40 (-1)3971566397
Leboncoin.fr41 (0)4170804564
Instagram42 (0)4269575990
Rakuten France43 (1)4469766179
Darty44 (-1)4368738348
Dailymotion45 (1)4666645871
Fnac46 (-1)4566658089
LA POSTE47 (0)4765627456
Doctolib48 (0)4865477980
YouTube49 (0)4945342664
Wish50 (0)5039235571

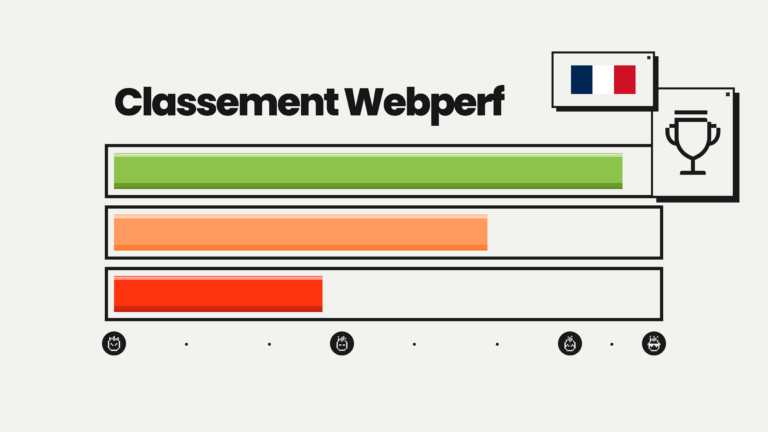
📊 Where Do France’s Top 50 Stand This Month?

distribution top 50 february

These figures reflect a generally solid performance across the top 50, but with disparities depending on the metric. INP remains the hardest to stabilise over time.

INP doesn’t measure a single interaction, it reflects the overall responsiveness of the user journey. A page might feel fast on the first click… but frustrating on the second.

Looking more closely at the distribution of performance, we can observe the proportion of sites reaching Google’s green threshold, meaning those for which at least 75% of users benefit from a good experience on the metric concerned.

February’s results reveal a mixed dynamic.

  • 50% of sites now pass all three Core Web Vitals, compared with 46% the previous month. This notable improvement shows that more and more players are managing to stabilise the user experience across the entire journey.
  • However, only 12% display a PX Index considered good, compared with 18% last month. This decline highlights that even though more sites are meeting the technical thresholds, the actual distribution of user experience remains uneven.

At Fasterize, we see this every day: web performance is a business lever as much as an SEO and UX factor. Automating, monitoring and maintaining these optimisations is essential to remain competitive.

Distribution by metric

  • 80% of sites reach the green threshold for LCP
  • 56% reach the green threshold for INP (vs 60% last month)
  • 82% of sites reach the green threshold for CLS

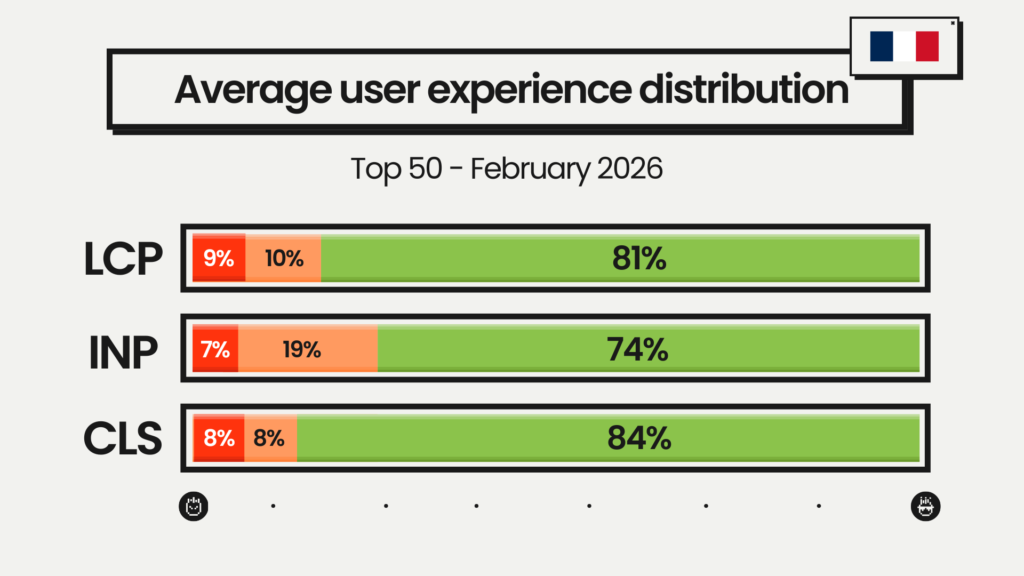
If we instead look at the average distribution of user experiences:

  • 19% of users experience a poor LCP

  • 16% encounter imperfect visual stability

  • 26% still experience average interactivity

These figures confirm a key point: 👉 even when sites pass the thresholds, a significant share of users still experience a less fluid experience.

This is precisely what the Performance Experience Index highlights: performance is not simply about reaching a threshold, but about reducing the proportion of users exposed to a degraded experience.

Now, here is the e-commerce ranking, for which web performance is a business and SEO challenge.

Most visited e-commerce sites: their user experience

The February e-commerce ranking confirms a trend observed over the past several months: leaders continue to maintain very high levels of performance, while the middle of the ranking remains highly sensitive, where even small variations in the share of users benefiting from a good experience can quickly shift positions.

In a sector where every friction point can lead to basket abandonment, the stability of the user experience remains a key conversion factor.


🏆 TOP 3: E-COMMERCE LEADERS

  1. 🥇 Sézane (1st) retains the top spot with a PX Index of 94. The site continues to stand out thanks to a particularly consistent experience, with over 90% of users in the green across all three metrics.

  2. 🥈 Ikea (2nd) remains firmly in second place (PX Index 93). The platform delivers a robust and balanced experience, with a very large majority of users benefiting from fast loading and smooth navigation.

  3. 🥉 Leroy Merlin (3rd) completes the podium with a PX Index of 92. The site maintains a stable experience despite the functional richness of its catalogue and the complexity of its journeys.

The top three are separated by less than two points on the PX Index: clear evidence that even micro-optimisations can tip the balance. These are examples to follow for staying competitive, boosting conversions, and delivering a flawless user experience.

📈 WHO’S MOVING UP?

Several players gained positions thanks to an improvement in the share of users benefiting from a good experience.

  • Gifi (9th, +4): the site climbs the ranking thanks to improved visual stability, with 90% of users now in the green for CLS, strengthening the overall smoothness of the journey.
  • Rakuten (25th, +2): gains a few positions thanks to improved visual stability for part of its audience, reducing disruptions during navigation.
  • Castorama (27th, +2): progresses thanks to combined improvements in LCP and INP, allowing more users to benefit from fast loading and smoother interactions.


🔻 WHO’S FALLING BEHIND?

Conversely, some players dropped in the ranking, often due to a deterioration in the share of users benefiting from a good experience.

  • Groupon (29th, −5): the most significant drop this month. The site recorded a decline across all metrics, particularly loading performance: 12% more users now experience poor LCP, with pages taking longer to display.
  • Auchan (12th, −3): the site drops due to a deterioration in initial loading, with a larger share of users experiencing slower LCP.

In e-commerce, the impacts are immediate: every millisecond lost can lead to abandoned baskets.

WebsiteRankingRanking
M-1
PX
Index
LCP
(% Good)
INP
(% Good)
CLS
(% Good)
Sézane1 (0)194969193
Ikea2 (0)293959093
Leroy Merlin3 (0)392948893
Cdiscount4 (0)491988194
Zalando5 (0)589918292

See the full ranking
WebsiteRankingRanking
M-1
PX
Index
LCP
(% Good)
INP
(% Good)
CLS
(% Good)
Sézane1 (0)194969193
Ikea2 (0)293959093
Leroy Merlin3 (0)392948893
Cdiscount4 (0)491988194
Zalando5 (0)589918292
Laredoute6 (0)689947796
Showroomprive7 (0)788878790
Conforama8 (0)887928393
Gifi9 (4)1387908990
AliExpress10 (0)1087898489
Ebay11 (0)1186867996
Auchan12 (-3)986868192
Amazon13 (-1)1285918079
Sephora14 (1)1584936286
BUT15 (-1)1484907479
Decathlon16 (1)1782865992
Manomano17 (-1)1681817884
Veepee18 (1)1980868167
Boulanger19 (-1)1878877686
Leclerc20 (0)2077797960
Etsy21 (0)2176828896
Carrefour22 (0)2273796946
Leboncoin23 (0)2370804564
Cultura24 (1)2570708172
Rakuten25 (2)2769766179
Darty26 (0)2668738348
Castorama27 (2)2967787084
Fnac28 (0)2866658089
Groupon29 (-5)2464627483
Shein30 (0)3059625979
Nocibe31 (0)3153673755
Wish32 (0)3239235571
📊 Where does the e-commerce leaderboard stand this month?
ux distribution february

On average, 13% of e-commerce sites achieve a PX Index considered excellent, while 32% meet all three Core Web Vitals.

  • 78% of sites reach the green threshold for LCP, indicating that initial loading is generally well under control.

  • 66% reach the green threshold for INP, confirming that interactivity remains a more difficult metric to stabilise.

  • 48% reach the green threshold for CLS, showing that visual stability still remains an area for improvement for part of the sector.

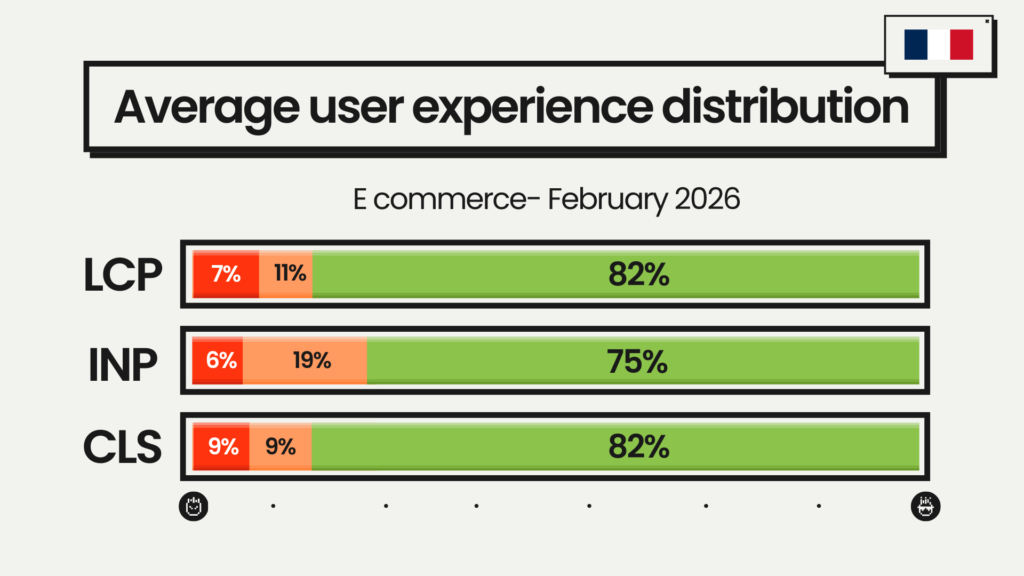
From the users’ perspective, the experience remains mixed:

  • 18% still experience slow loading (LCP)

  • 25% face degraded interactivity (INP)

  • 19% encounter visual stability issues (CLS)

These results are partly explained by the post-sales period, during which sites are emerging from a peak in traffic and numerous updates (catalogues, promotions, marketing campaigns).

Maintaining a stable level of performance after these periods of intense activity remains a challenge, but also represents a key lever for preserving conversion rates and user satisfaction.


Media sites: ranking of the most visited mobile platforms

In the media sector, web performance remains a key engagement factor. Page loading speed, visual stability, and responsiveness directly determine reading comfort and user retention.


🏆 TOP 3: MEDIA LEADERS

  1. 🥇 BFMTV (1st, stable) retains the top spot with a PX Index of 91. The site delivers a solid and consistent experience, with more than 85% of users in the green across all metrics.

  2. 🥈 Franceinfo (2nd, stable) confirms its position thanks to excellent visual stability, with 95% of users benefiting from a green CLS, ensuring optimal reading comfort despite frequent content updates.

  3. 🥉 Actu (3rd, stable) completes the podium with a very robust experience, driven by a particularly strong LCP, with over 93% of users in the green.

The gaps remain tight at the top of the ranking, where even the smallest optimisation can make a difference. The top trio therefore remains unchanged, demonstrating strong web performance maturity among these players.


📈 CLIMBING THE RANKS THIS MONTH:

  • 20 Minutes (4th, +4): one of the most notable climbs this month, driven by improved visual stability. 94% of users now benefit from a green CLS, an increase of +9% compared with last month, significantly improving reading comfort.

  • L’Équipe (6th, +3): the site progresses thanks to slight improvements across all metrics, increasing the share of users benefiting from a good overall experience.

These improvements show that gradual optimisation of performance distribution can be enough to gain several places in a very tight ranking.


🔻 DECLINES:

  • Le Parisien (8th, −3): the site drops slightly in the ranking in a highly competitive context where several players are progressing faster.

  • Le Figaro (10th, −3): the decline is partly explained by worsening visual stability, with a larger share of users experiencing layout shifts during loading.

These variations illustrate a reality of the sector: performance must be continuously maintained, as a few percentage points in distribution can be enough to shift the ranking.
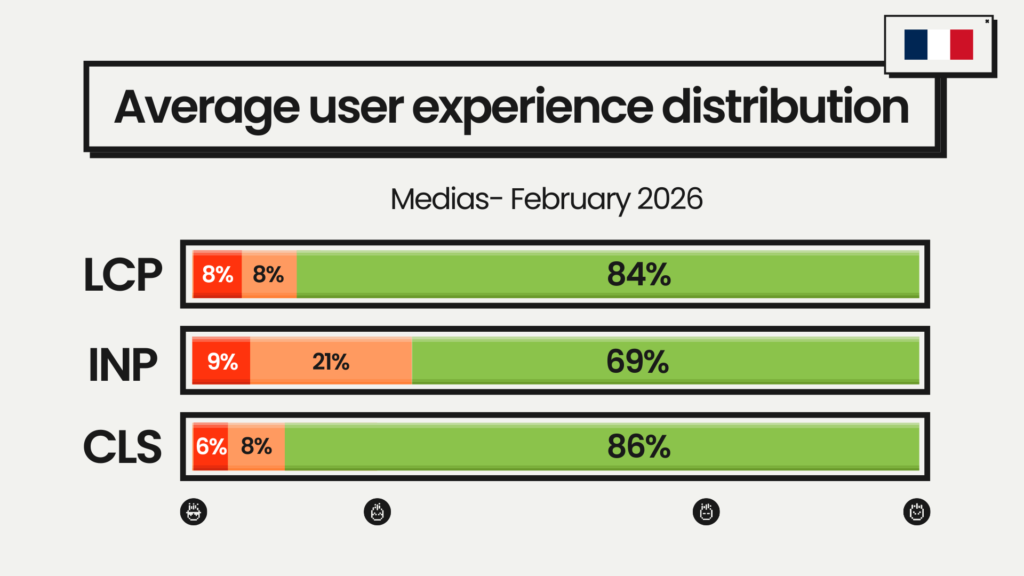
WebsiteRankingRanking
M-1
PX
Index
LCP
(% Good)
INP
(% Good)
CLS
(% Good)
BFMTV1 (0)191928788
Franceinfo2 (0)289878995
Actu3 (0)389937791
20minutes4 (4)888878194
Le monde5 (-1)488938877

See the full ranking
WebsiteRankingRanking
M-1
PX
Index
LCP
(% Good)
INP
(% Good)
CLS
(% Good)
BFMTV1 (0)191928788
Franceinfo2 (0)289878995
Actu3 (0)389937791
20minutes4 (4)888878194
Le monde5 (-1)488938877
L’équipe6 (3)987917784
Gala7 (-1)687947284
Le Parisien8 (-3)587877792
Ouest-France9 (1)1085937679
Le Figaro10 (-3)785956679
Le journal des femmes11 (0)1185867384
programme-tv.net12 (0)1284876695
Voici13 (0)1383876093
L’internaute14 (2)1682856780
marmiton.org15 (0)1581786889
Femme Actuelle16 (-2)1480835892
Yahoo17 (0)1775826295
Dailymotion18 (0)1866645871
Youtube19 (0)1945342664
📊 Where does the media ranking stand this month?
 

ux distribution february

On average:

  • 84% of users benefit from a good LCP, showing that loading of the main content is generally well controlled

  • 69% benefit from good interactivity (INP), a metric that remains more difficult to stabilise

  • 86% enjoy good visual stability (CLS), ensuring satisfactory reading comfort

Overall, the media sector remains mature in terms of web performance, although some metrics remain harder to optimise consistently over time.

  • 5% of sites achieve a PX Index above 90

  • 42% of sites meet all three Core Web Vitals

In detail:

  • 89% of sites reach the green threshold for LCP, showing that initial loading is now widely under control

  • 42% reach the green threshold for INP, confirming that interactivity remains the sector’s main challenge

  • 89% reach the green threshold for CLS, indicating generally satisfactory visual stability

Maintaining these levels, rather than chasing occasional peaks, will be key to ensuring a smooth reading experience.


Travel: Performance of the most visited travel websites

Comparison engines, booking platforms and transport operators must deal with complex user journeys, high functional density, large volumes of data, and highly variable traffic peaks depending on the season. In this context, ensuring a smooth and stable experience for the majority of users remains a challenge.

This ranking highlights a sector where performance is progressing slowly, but where the gaps remain significant compared with other verticals.


🏆 TOP 3: TRAVEL LEADERS

  1.  🥇 easyvoyage (1st, stable) retains the top spot with a PX Index of 90 and remains the only player in the sector to reach a level considered excellent. The site delivers a particularly balanced experience, with more than 85% of users in the green across all metrics.
  2. 🥈 ViaMichelin (2nd, stable) confirms its robustness with a PX Index of 82, driven by excellent visual stability. Interactivity remains more fragile, however, which limits its progression.
  3. 🥉 SNCF Connect (3rd, stable) completes the podium with a PX Index also at 82. The site offers a generally solid experience, with interactivity well controlled for a large proportion of users.


📈 ON THE RISE:

  • fr.hotels (8th, +2)
    The site continues its progression with improvements across all metrics. Interactivity is improving in particular: 70% of users now benefit from a green INP, an encouraging development that brings the metric closer to the recommended threshold.


🔻 DECLINES:

  • Airbnb (15th, −2)
    The site slips slightly in the ranking due to a small deterioration in the distribution of metrics, with a larger share of users experiencing an average experience.
WebsiteRankingRanking
M-1
PX
Index
LCP
(% Good)
INP
(% Good)
CLS
(% Good)
easyvoyage1 (0)190948595
viamichelin2 (0)282914895
sncf-connect3 (0)382818283
tripadvisor4 (0)480837676
mappy5 (0)575765786

Voir le classement complet
WebsiteRankingRanking
M-1
PX
Index
LCP
(% Good)
INP
(% Good)
CLS
(% Good)
easyvoyage1 (0)190948595
viamichelin2 (0)282914895
sncf-connect3 (0)382818283
tripadvisor4 (0)480837676
mappy5 (0)575765786
abritel6 (0)675796983
trivago7 (0)773803582
fr.hotels8 (2)1072677078
viagogo9 (-1)872747676
liligo10 (-1)970615669
thetrainline11 (0)1168813664
ouigo12 (0)1267784248
kayak13 (1)1464685549
skyscanner14 (1)1563604073
airbnb15 (-2)1363604560
all accor16 (0)1663605084
booking17 (0)1760635793
opodo18 (0)1856484258
airfrance19 (0)1950522556

📊 Where does the travel ranking stand this month?
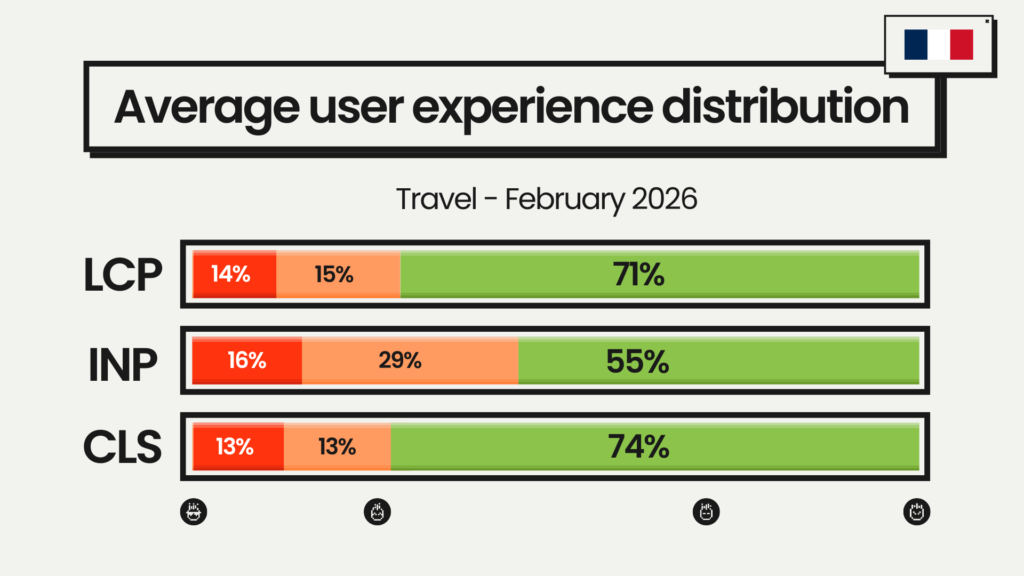
ux distribution february

On average:

  • 29% of users experience slow loading (LCP)

  • 45% face degraded interactivity (INP)

  • 26% encounter imperfect visual stability (CLS

❌ The travel sector remains the most behind among the major verticals analysed.


Only one site exceeds a PX Index of 90, and the sector’s average PX Index is capped at 70, compared with 79 for e-commerce and 82 for media.

  • 16% of sites meet all three Core Web Vitals

  • 47% reach the green threshold for LCP

  • 21% (vs 16% last month) reach the green threshold for INP

  • 58% (vs 52%) reach the green threshold for CLS

The signals are nevertheless slightly positive: some platforms are implementing targeted optimisations, particularly on initial loading and visual stability. INP still remains the main barrier to faster improvements in user experience across the sector.

Web performance is no longer just about an isolated technical metric: it’s about the site’s ability to continuously offer a good experience to the majority of users.


This month’s variations, between sectors and between individual sites, show that a few targeted optimisations can drive quick progress, but sites can just as quickly fall back if they ease up on their efforts. Meeting Google’s green threshold is a step; maintaining it is the real challenge.

In this context, web performance becomes a strategic lever in its own right, at the crossroads of UX, SEO, and business. Improving the proportion of users in the green means reducing friction, securing journeys, and creating long-lasting competitive advantage.

Where does your site rank?

Analyse your site’s performance in 1 click and compare yourself to the leaders in your sector:

  1. ✅ Assess the percentage of users enjoying a good experience
  2. ✅ Get your PX Index
  3. ✅ Compare yourself to your competitors and sector

And what better way to kick off this effort than with the support of web performance experts?
Fasterize is here to guide you with concrete solutions to make your site faster, more stable, and more responsive.

⭐ See you next month for another deep dive into the web experience of France’s top sites!

Sommaire
Test your site's performance in 1 click

Discover other articles…

Capture d’écran 2026-04-13 à 11.40.20

At BrightonSEO 2026, Valentine Jahan will explain why traditional SEO roadmaps are obsolete and how to adopt a Real-Time-First approach combining AI and EdgeSEO to

beige blog banner

Is your brand really visible on Google and other search engines? Find out where you appear, who your competitors are, and how your visibility has

Boost your site speed now with EdgeSpeed!