


Speed Index for the E-commerce, Retail, Travel and Media sectors
Cell phones are used by 54% of Internet users: the majority of web traffic now comes from this device. Despite machines with varying degrees of performance and connections with varying speeds, loading speed is themain requirement of users. Having a fast site is therefore essential for ensuring conversion rates and increasing sales, as well as optimizing UX and even SEO! Orange-Marine.com, for example, increased its mobile traffic by 25% by improving its webperf, and IKKS saw its mobile conversion rates increase by 20% with new customers.
So, when it comes to loading times, what are the trends by sector?
Among other things, this study shows the differences in mobile performance between Retail, Travel and Media e-tailers.
Here’s a first example, based on the average Speed Index observed for each.
Retailers come out on top with an average Speed Index of 6,866 ms over 2018, ahead of tour operators whose average Speed Index stands at 7,008 ms. Press sites, meanwhile, reach an average Speed Index of 7,383 ms.

Webperf seasonality by sector
In terms of periodicity, we also note that retailers tend to worry about their loading times mainly during periods of commercial concentration (Sales, Black Friday, Cyber Monday...), while players in the Travel sector implement optimizations as early as May – the period of bridges and preparations for summer vacations. Media sites also see their performance slacken during the summer, when news and advertising activity is generally quieter. For more details, download the graphical representation of these curves directly from the study.
Interactivity at the heart of webperf
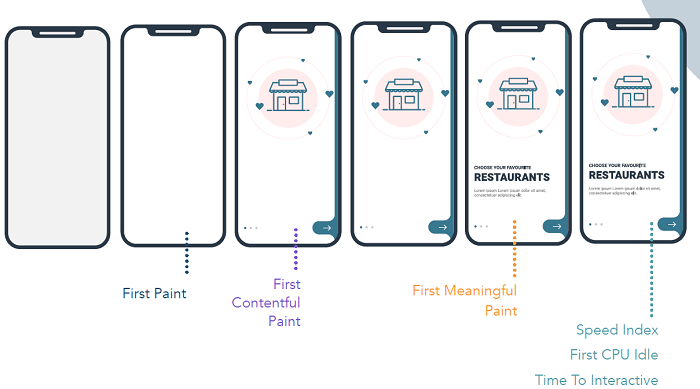
In an attempt to measure the speed perceived by web surfers with ever greater precision, a new indicator has emerged to assess the interactivity of a page: Time To Interactive.
Interactivity has become a central element in web performance measurement, and this study will give you a better understanding of what’s at stake, how it’s assessed today, and how each sector positions itself.
In our webperf study, you’ll also find a comparison of TTI between Travel, E-commerce (retail) and Media sites.
You’ll also find a detailed analysis of the performance of the E-Commerce, Travel and Media sectors, zooming in on each to find out about average loading times, the best and worst performers, as well as page weights and the average number of requests.
This gives you all the information you need to compare these metrics with your own market performance!
You can also discover the best webperf practices – and the worst – observed in 2018, and understand how the main indicators are calculated thanks to a webperf lexicon.


