According to Google, on mobile, 1 second of additional loading time can decrease conversions by 20%; in addition, navigation difficulties are one of the main reasons for cart abandonment (19%). Speed has an impact that goes well beyond the comfort of your users, it is also a business issue.
If observing the loading of a page “with the naked eye as a visitor allows you to realize that it needs optimizations, you can imagine that it is not enough. You have to precisely identify the causes of the slowness to activate the right levers and effectively boost performance. This is why, to improve the display speed of a website, an analysis phase and a detailed audit are essential.
So, before taking action to optimize the frontend automatically using our SaaS solution , but also to provide our customers with recommendations to apply internally , our experts audit their websites from every angle. Image loading, resource compression, HTML code, CSS, JavaScript… everything is observed under a microscope. With which tools and which techniques ?
Stéphane Rios , CEO, Anthony Barré , CTO, and Nicolas Hodin , Customer Success Engineer, each reveal their 3 favorite tools and tips for aiming for the best possible score on PageSpeed Insights (PSI).
Stéphane Rios, CEO: X-ray analysis of websites
Stéphane Rios is not only the founder and CEO of Fasterize, he is also a radiologist
To detect what’s stuck during page loading, and how to improve metrics and performance scores, here are his favorite tools.
The WebPageTest waterfall for a first contact
“When I discover a website, I will see the source code first, and then the WebPageTest waterfall . I then know very quickly how the page is built, the technologies used, and even the webperf maturity level.
For example, if I see several hundred queries and heavy items, I deduce that there has not yet been any performance optimization work, or in any case that the basics need to be redone to improve the PageSpeed Insights score and the user experience.
With WebPageTest, I can also identify the critical path , and see if loading certain elements blocks everything else by “clogging the pipes”, when we would obviously like loading to start as soon as possible.
This data helps to understand the origin of Start Render / First Contentful Paint issues (FCP which is part of the Lighthouse and PageSpeed Insights score calculation ).
WebPageTest also gives me important information about the execution of the JavaScript : if the waterfall contains a lot of pink bars , it means that there are optimizations to be made on the loading of the scripts.
In summary, WebPageTest, which is a webperf reference tool, allows me to X-ray a page, and to go very far in the analysis of the loading with its many detailed sections.”
Chrome DevTools for Surgical Analysis
“After the X-ray, I move on to surgery with the browser developer tools. They allow me to identify what needs to be optimized to improve loading speed , and therefore the PageSpeed Insights score.
For example, in the JavaScript section, I can test different third-party scripts to see which ones are slowing down the page load. Later, optimizing their loading can be easily automated using our DeferJS feature .
On Chrome, DevTools can seem intimidating given all the possibilities they offer, but they allow for very high precision in performance analysis.”
Yellow Lab Tools for Thinking Outside the Box
“To test the speed of a site, we don’t think about Yellow Lab Tools often enough, and that’s a shame! It provides information that others don’t offer . For example, in addition to an overall view of performance, it allows you to know the number of colors on a page , the depth of the DOM , the complexity of JavaScript and CSS , how many versions of JQuery are loaded… This tool, which goes off the beaten track, is a very good complement to more classic tools.”

Yellow Lab Tools Performance Testing Tool Results Page
Anthony Barré, CTO: the webperf toolbox for inspecting and debugging pages
Anthony Barré is CTO of Fasterize. For a thorough audit of a website’s performance, to understand what slows down loading and to optimize it, he always has his webperf Swiss army knife on hand.
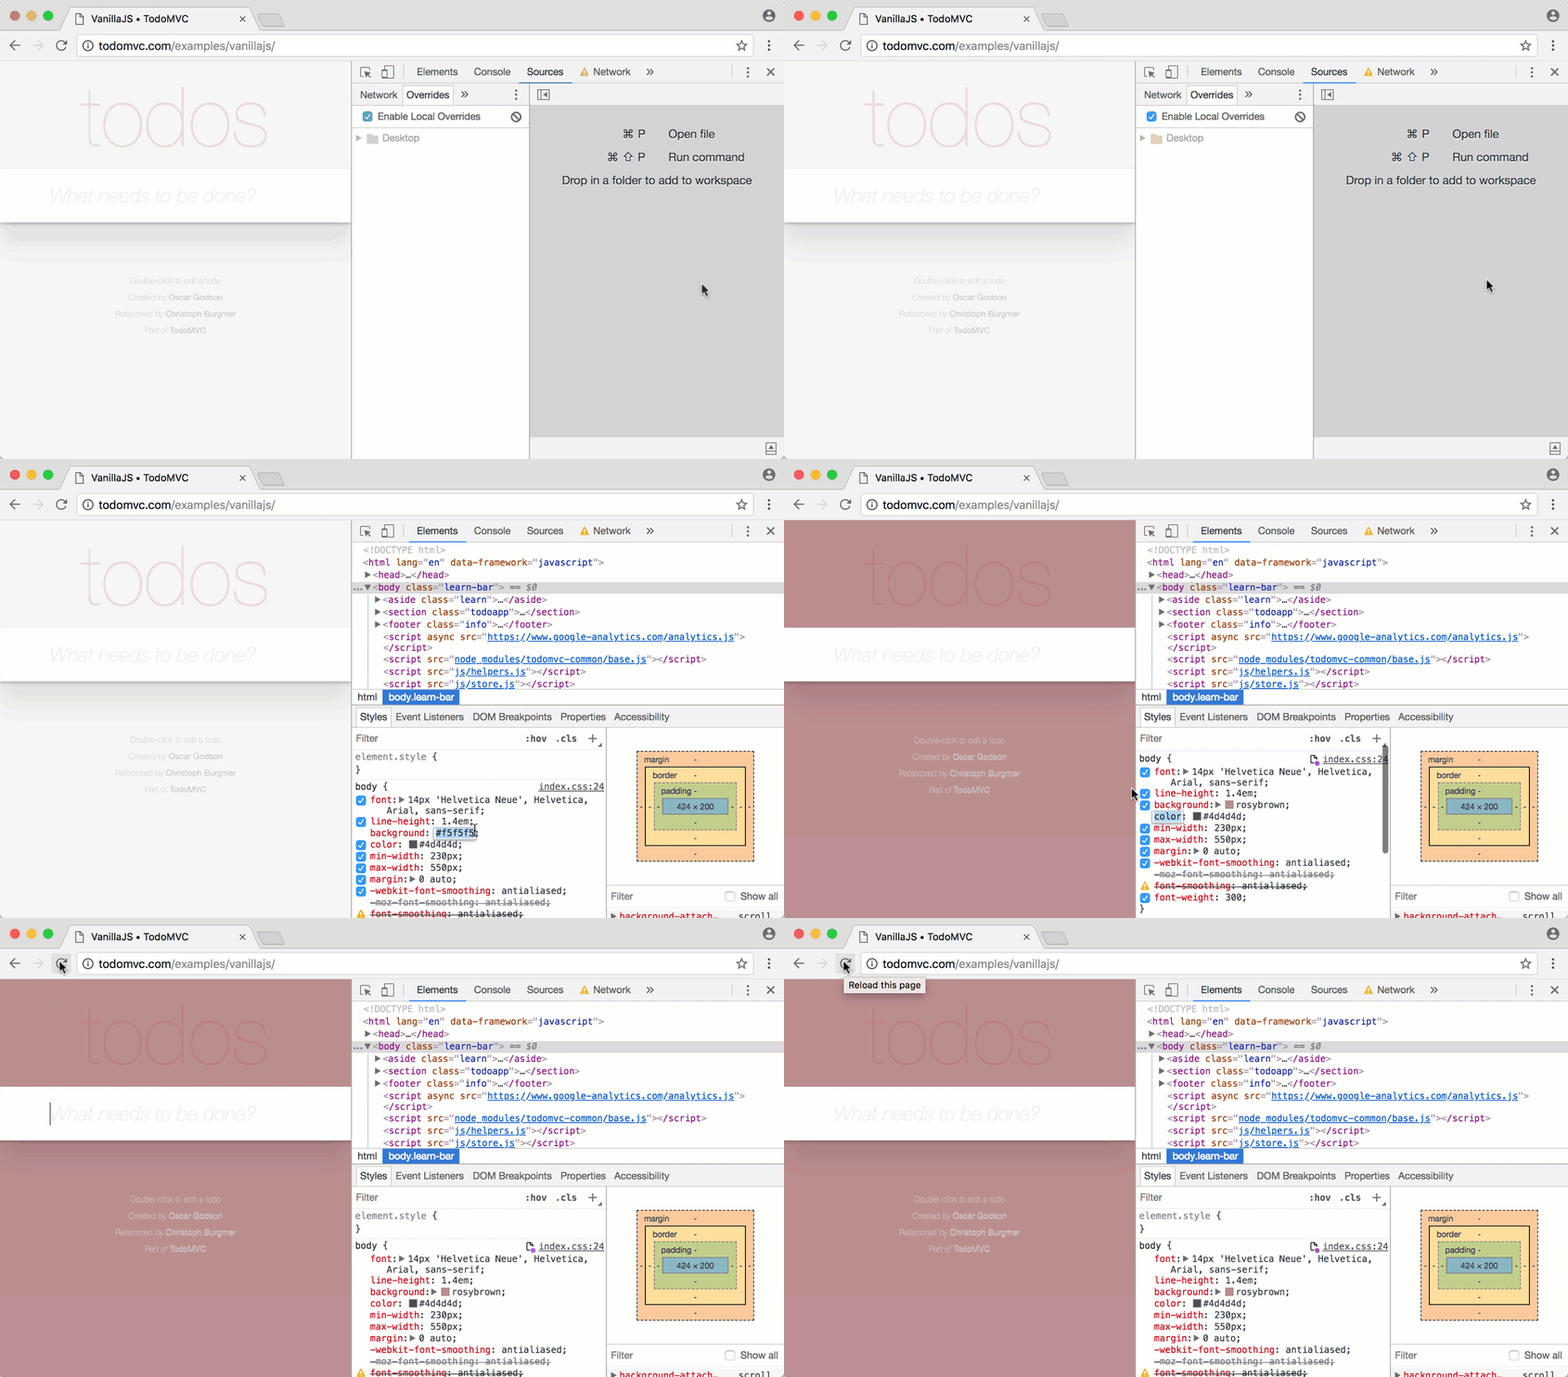
Chrome DevTools to rewrite files live and locally on a page and test performance
“DevTools allows you to rewrite JavaScript, CSS or HTML files on the fly!
This is a really interesting feature for testing the correction of performance issues, and more broadly of functional bugs outside of webperf.
I can put cleaned code in place of what I see in the original source code and measure the impact; and I can also measure the effects of my test on Core Web Vitals (70% of PageSpeed Insights score) with the extension provided to inspect the code.
Concretely, this option has already been very useful to me to correct a compatibility problem on consent scripts for cookies .”

Preview of on-the-fly code rewriting in Chrome DevTools with Local Overrides (source Developer.chrome )
Treo to visualize Core Web Vitals with Google CrUX data
“ Treo is a great tool to make Lighthouse data easier to access, with a less technical view.
In the free version, you can see the Core Web Vitals of sites in Google’s CrUX panel ; and in the paid version, the user can monitor the Core Web Vitals of their own site based on data from Lighthouse.
One of the Treo features I really like: Core Web Vitals analysis based on mobile and desktop devices , browsers, connection types, by country…”
WebPageTest to test speed without cookie banner
“Analyzing the speed of a website in different browsing contexts is essential for a performance audit – something that Synthetic Monitoring tools allow you to do.
For reliable data on the behavior of a page with and without cookie consent banners , I use for example one of the advanced features of WebPageTest with the help of a dedicated script .”
Nicolas Hodin, Customer Success Engineer: testing Core Web Vitals in depth
Nicolas Hodin is a Customer Success Engineer. At the heart of customer issues, webperf audits are part of his daily life. For precise data on performance and loading speed, here are his 3 recommendations.
The Web Vitals tab of WebPageTest
“I regularly use the Web Vitals tab of WebPageTest, which allows you to finely analyze the UX and SEO metrics highlighted by Google.
For example, the LCP Event Summary section goes into great detail to analyze the Largest Contentful Paint , one of the 3 Core Web Vitals that indicates when the largest element in terms of size is displayed on a page during load.
The Web Vitals tab is also very useful for viewing layout shifts, which Google recommends to minimize for a good Cumulative Layout Shift score , and therefore a good user experience. Simply hover over the image to see the layout shift and its importance.
Another tip : the Block tab which allows you to add blocking patterns , for example to block third parties on a URL and measure the loading speed with and without.”

I would add that the advantage of viewing Core Web Vitals in WebPageTest is that you can choose the test conditions very precisely: browser, connection, device, etc. Whereas with PageSpeed Insights, you are dependent on the conditions defined by Google .”
The Throttle option in the Network section in Chrome DevTools
“To know how a page loads, other than on a high-performance device with a super fiber connection, I use the Throttle option of Chrome DevTools. It allows me to emulate a weak connection to slow down the navigation, and understand how the page loads in degraded conditions.
In addition, the Performance tab allows you to launch the loading of a page and see all the steps with a profiling of the components in the form of a flamechart . I can then visualize the entire execution of the JavaScript to identify those that consume the most time .”

Flamechart generated with Chrome DevTools to visualize JavaScript loading
and identify the most demanding ones (which can degrade the responsiveness of a web page, which Google evaluates with the First Input Delay )
The “Quick JavaScript Switcher” Chrome extension
“Quick JavaScript Switcher is very useful to disable all the JavaScript code of a page, and see how it loads without all its scripts ( first or third party ). The extension reloads the page to be tested by disabling the JS , and based on this information, I then know what needs to be optimized… outside of the scripts. I can notably see if there are images in the viewport whose display depends on a script.”
As you will have understood, WebPageTest is one of the essentials for auditing the performance of a site. It is a complete and powerful solution, acclaimed and enriched by the webperf community, with multiple options to explore the many facets of page loading.
Google also offers a suite of free tools to analyze loading speed, and optimize it to meet UX and SEO challenges… and as you have seen, these are not the only solutions. There is a wide choice to equip you to test your loading speed , and analyze your pages. Also, to see clearly in the results and use them effectively, take advantage of support from webperf professionals…
Our experts analyze your site in depth and provide you with personalized recommendations to apply internally:


