french ranking

Ranking: the user experience of the most visited sites in France!

Sommaire

It’s time to dive into the user experience ranking of the most visited websites in France.


For over a decade, we’ve analysed the performance of the most visited French websites every month. These rankings, based on data from the Chrome User Experience Report (CrUX) and Google’s Core Web Vitals, have become a benchmark for assessing market maturity in terms of user experience.

Until now, websites were ranked based on a score derived from their compliance with Google’s recommended thresholds. This framework helped structure market priorities and widely contributed to the democratisation of web performance.

But over time, a key limitation has emerged: a website can meet all the Core Web Vitals thresholds while still delivering a poor experience to a significant portion of its audience.


At Fasterize, we’ve chosen to put users back at the heart of measurement. Performance can no longer be assessed solely as technical compliance, but must reflect the real-world experience users have throughout their journey.

This belief led us to evolve our historical scoring method into the Performance Experience Index (PX Index). As of January 2026, all our rankings are now based on the PX Index.

The Performance Experience Index (PX Index)

The PX Index is scored from 0 to 100 and measures the real share of users benefiting from a good experience on a website. It is based on real-world user data from the Chrome UX Report, and on all the key metrics that shape the user journey : from server response time to on-screen interactions.

The overall score is calculated as a weighted average of the percentage of users having a good experience, with each metric weighted according to its real impact on perceived performance:

  • LCP represents 30%
  • CLS represents 20%
  • INP represents 20%
  • FCP represents 15%
  • TTFB represents 15%

The full methodology is detailed in this article.

🤖 Summarize this article with :

With this new methodology, the rankings offer a new lens.

We no longer focus solely on the 75th percentile values of each metric to determine whether a site “passes the thresholds”, but instead display the percentage of users having a good experience, in other words, those exceeding the threshold.

A percentage of 75% or more means that the metric meets Google’s “Good” threshold, as over 75% of users are experiencing a high-quality visit.


Each month, we analyze the mobile web performance of:

✅ The 50 most visited websites in France
🛒 The top 30 e-commerce platforms
📰 The top 20 media outlets
✈️ The 20 leading travel websites

Let’s dive into the January 2025 leaderboard.


Web Performance ranking: France’s 50 most visited sites

🏆 TOP 3: WHO’S LEADING THE PACK?

  1. 🥇 impots.gouv.fr takes the top spot with a PX Index of 93. The site stands out with over 90% of users in the green across LCP, INP, and CLS, an impressive all-round performance.
  2. 🥈 Leroy Merlin climbs one place, showcasing maturity in web performance. Despite a feature-rich site, it delivers a stable, fast experience: 95% enjoy a fast LCP, and over 85% experience smooth interactivity.
  3. 🥉 Assurance Maladie remains firmly in the top three, with a consistently stable user experience for the majority of its visitors.
 

📈 BIGGEST IMPROVEMENTS IN THE TOP 50

Several websites made significant gains in January by increasing the percentage of users in the green, especially on critical metrics:

  • L’Équipe (19ᵗʰ, +11): +13% users in green on INP, +10% on CLS. All metrics are now above the threshold.

  • Service-Public.fr (25ᵗʰ, +9): +15% in green on LCP, pushing the metric into “Good” territory.

  • 20 Minutes (18ᵗʰ, +5): +15% in green on CLS, improving visual stability.

  • SFR (23ᵗʰ, +4): +16% in green on INP, indicating smoother interactivity.


These gains prove that even seemingly minor improvements can have a major impact. They reflect sustained optimisation efforts — particularly around Interaction to Next Paint (INP). Remember: good FID doesn’t guarantee good INP. FID only measures the first interaction, whereas INP evaluates responsiveness across the entire session.


🔻 FALLING BACK

Some websites dropped in the rankings due to either a decline in the percentage of users enjoying a good experience or a lack of progress in an increasingly competitive field:

  • linternaute.com (32ᵗʰ, −6): −5% in green on CLS, indicating a drop in visual stability.

  • Le Journal des Femmes (24ᵗʰ, −5): −6% on LCP, pushing more users into the orange. This affects how quickly users access main content.

  • But (27ᵗʰ, −5): No specific degradation observed, but a lack of momentum penalises its ranking.

  • Free (20ᵗʰ, −4): Similarly, no significant drop — but other sites are simply progressing faster.

These drops are a reminder: performance gains must be continuously maintained. Without consistent monitoring, it’s easy to slip backwards.

WebsiteRankingRanking
M-1
PX
Index
LCP
(% Good)
INP
(% Good)
CLS
(% Good)
impots.gouv.fr1 (0)193959298
Leroy Merlin2 (1)392958792
Assurance Maladie3 (-1)292949496
BFM TV4 (0)491948790
Cdiscount5 (0)591987993

See the full ranking
SitesClassementClassement
M-1
PX
Index
LCP
(% Good)
INP
(% Good)
CLS
(% Good)
impots.gouv.fr1 (0)193959298
Leroy Merlin2 (1)392958792
Assurance Maladie3 (-1)292949496
BFM TV4 (0)491948790
Cdiscount5 (0)591987993
Ministere de l’Intérieur6 (2)891899198
Franceinfo7 (0)790938295
La Redoute8 (1)990947796
Google9 (-3)690927896
Actu.fr10 (1)1189937691
Bing11 (-1)1088907991
Le Monde12 (1)1388928779
AliExpress13 (-1)1287908489
Le Parisien14 (1)1587877792
Gala15 (2)1787957183
eBay16 (-2)1486877996
Le Figaro17 (1)1886956782
20 Minutes18 (5)2386878084
L’Équipe19 (11)3086907684
Free20 (-4)1686859275
Ouest France21 (0)2185937779
Amazon22 (-2)2085918078
SFR23 (4)2785828594
Le Journal des Femmes24 (-5)1984837386
Service-Public.fr25 (9)3484876596
Voici26 (-2)2484876492
But27 (-5)2284927376
Tele Loisirs28 (-3)2583887085
PagesJaunes29 (-1)2882848977
Femme Actuelle30 (2)3281836093
Marmiton31 (-2)2981796590
Linternaute.com32 (-6)2681826877
Orange33 (-2)3180757593
Boulanger34 (-1)3380877786
E.Leclerc35 (1)3678797962
Credit Agricole36 (1)3777788061
Carrefour37 (-2)3577816962
Yahoo38 (0)3876846396
Facebook39 (0)3971566397
Vinted40 (0)4071716589
Leboncoin.fr41 (2)4370794564
Instagram42 (-1)4169586088
Darty43 (2)4569748355
Rakuten France44 (-2)4268776177
Fnac45 (-1)4468688189
Dailymotion46 (0)4667645774
LA POSTE47 (1)4864557651
Doctolib48 (-1)4762427678
YouTube49 (0)4945322767
Wish50 (0)5039225573

📊 Where Do France’s Top 50 Stand This Month?

User experience distribution – Top 50 – January 2026

These figures reflect a generally solid performance across the top 50, but with disparities depending on the metric. INP remains the hardest to stabilise over time.

INP doesn’t measure a single interaction, it reflects the overall responsiveness of the user journey. A page might feel fast on the first click… but frustrating on the second.

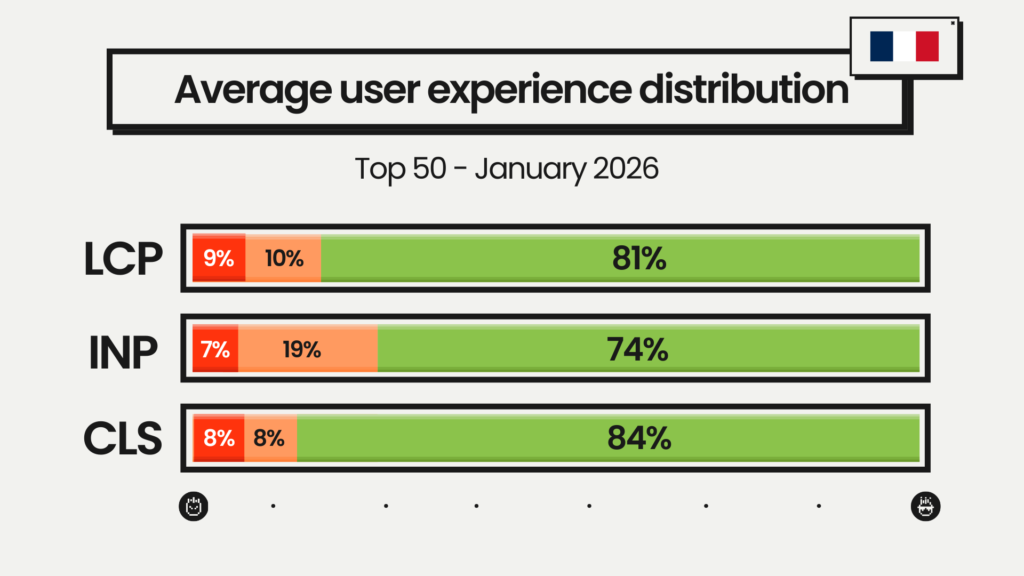
Looking deeper, here’s the share of websites where at least 75% of users meet the “Good” threshold:

  • 18% pass all 3 Core Web Vitals

  • 46% have a PX Index considered “Good”

  • 60% reach the threshold on LCP

  • 80% on INP

  • 82% on CLS

At Fasterize, we see this daily: web performance is as much a business driver as a UX and SEO issue. Automating, monitoring, and maintaining performance is key to staying ahead.

Now, here is the e-commerce ranking, for which web performance is a business and SEO challenge.

Most visited e-commerce sites: their user experience

E-commerce platforms are emerging from the most demanding period of the year, and the gap is widening between those that managed to maintain performance under pressure and those whose experience has started to erode.

This month, the top of the leaderboard remains very tight, proof that the leading brands are continuously refining their UX to stay competitive, while others are already showing signs of strain.


🏆 TOP 3: E-COMMERCE LEADERS

  1. 🥇 Sézane (1st, +2) climbs to the top with a PX Index of 94. The site stands out thanks to an improvement in CLS, with +6% of users experiencing good visual stability, reinforcing a smooth and reassuring purchase journey.
  2. 🥈 Ikea (2nd, -1) maintains a high level of performance. The platform delivers a robust and consistent experience, with a large majority of users in the green across all key metrics.
  3. 🥉 Leroy Merlin (3rd, -1) remains on the podium. Continued efforts on INP will be needed to hold this position and improve the overall experience.

The top three are separated by less than two points on the PX Index: clear evidence that even micro-optimisations can tip the balance. These are examples to follow for staying competitive, boosting conversions, and delivering a flawless user experience.

📈 WHO’S MOVING UP?

  • Darty (26th, +3)
    An +8% increase in users enjoying a good experience on INP, indicating smoother interactivity. However, a worsening CLS could weaken visual stability if left unaddressed.

🔻 WHO’S FALLING BEHIND?

While not alarming, some sites are seeing a decline in UX:

  • Etsy (21st, -3)
    Etsy’s drop is not due to a deterioration in metrics. The overall experience remains stable, but a lack of improvement in a highly competitive field is enough to slip a few places.
  • Rakuten (27th, -3)
    Rakuten has seen a drop in interactivity, with +16% more users having a poor experience on INP. A damaging shift for an e-commerce site, where fluidity of interaction is crucial in the purchase journey.

In e-commerce, the impacts are immediate: every millisecond lost can lead to abandoned baskets.
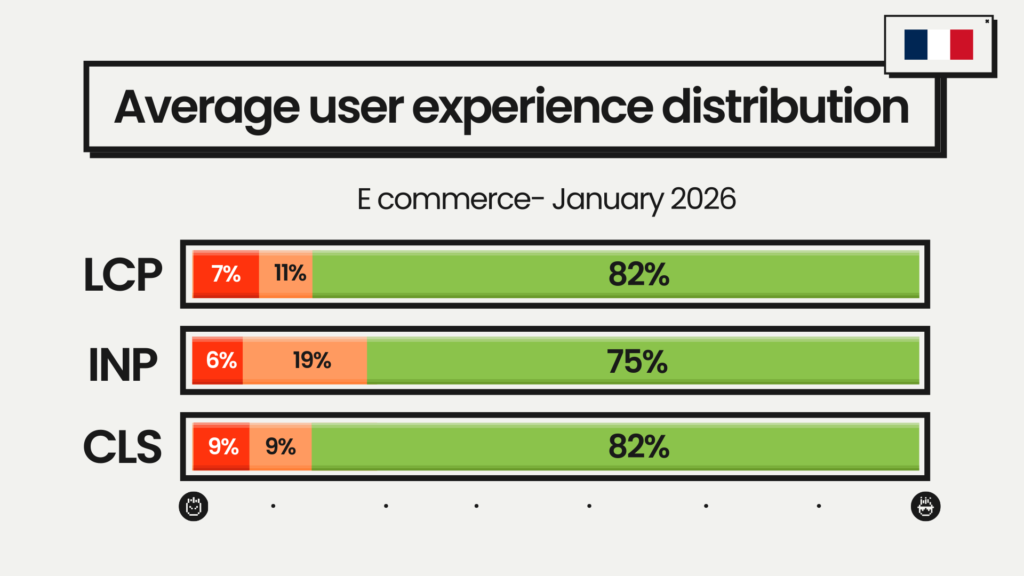
WebsiteRankingRanking
M-1
PX IndexLCP(% Good)INP(% Good)CLS(% Good)
Sézane1 (2)394979194
Ikea2 (-1)193959093
Leroy Merlin3 (-1)292958792
Cdiscount4 (0)491987993
Zalando5 (0)590928294

See the full ranking
WebsiteRankingRanking
M-1
PX IndexLCP(% Good)INP(% Good)CLS(% Good)
Sézane1 (2)394979194
Ikea2 (-1)193959093
Leroy Merlin3 (-1)292958792
Cdiscount4 (0)491987993
Zalando5 (0)590928294
Laredoute6 (0)690947796
Showroomprive7 (0)788878688
Conforama8 (1)987928392
Auchan9 (2)1187898092
AliExpress10 (-2)887908489
Ebay11 (-1)1086877996
Amazon12 (1)1385918078
Gifi13 (-1)1285898885
BUT14 (0)1484927376
Sephora15 (0)1583916188
Manomano16 (0)1683858084
Decathlon17 (0)1781865490
Boulanger18 (1)1980877786
Veepee19 (2)2180838169
Leclerc20 (2)2278797962
Etsy21 (-3)1877848896
Carrefour22 (-2)2077816962
Leboncoin23 (2)2570794564
Groupon24 (-1)2370747988
Cultura25 (1)2669728165
Darty26 (3)2969748355
Rakuten27 (-3)2468776177
Fnac28 (0)2868688189
Castorama29 (-2)2766766685
Shein30 (0)3058615879
Nocibe31 (0)3156713752
Wish32 (0)3239225573
📊 Where does the e-commerce leaderboard stand this month?
Average user experience distribution – e-commerce

On average:

  • 84% of users benefit from a good LCP (loading of main content)

  • 75% enjoy good interactivity (INP)

  • 82% experience good visual stability (CLS)

Overall, nearly half of e-commerce sites have a PX Index over 90!

  • 18% of sites meet all 3 Core Web Vitals

  • 50% reach a PX Index considered “good”

  • 78% meet the green threshold on LCP

  • 68% meet the green threshold on INP

  • 75% meet the green threshold on CLS

Those who anticipated this critical phase ahead of the commercial season now approach traffic peaks from a position of strength, with a better user experience, optimised conversions, and more profitable acquisition costs.

Media sites: ranking of the most visited mobile platforms

Speed, interactivity and stability are now just as vital for retention as editorial quality. 

🏆 TOP 3: MEDIA LEADERS

  1. 🥇 BFMTV (1st, stable) retains the top spot with a PX Index of 91. The site delivers a highly consistent experience, with over 85% of users in the green across all key metrics.
  2. 🥈 Franceinfo (2nd, stable) stands out particularly for its excellent visual stability, ensuring comfortable reading despite frequent content updates.
  3. 🥉 Actu (3rd, stable) completes the podium with a robust experience, supported by an LCP and CLS well above the green threshold: ensuring quick and clear access to information.

The margins remain tight at the top of the ranking, where even the smallest optimisation can make a difference!


📈 CLIMBING THE RANKS THIS MONTH:

  • 20 Minutes (8th, +2): improvement in visual stability, with +15% more users in the green for CLS, a key gain for a site where immediate readability drives engagement.

  • L’Équipe (9th, +6): one of the strongest climbers this month, with +13% more users in the green for INP and +10% for CLS.

  • Femme Actuelle (14th, +2): a more discreet but steady optimisation effort, strengthening the user experience, particularly around page stability.


🔻 DECLINES:

Conversely, some sites slipped due to a measured decline in user experience, often tied to a single key metric.

  • Le Journal des Femmes (11th, -3): dropped due to worsening LCP, with around 5% more users experiencing a poor start-of-load experience.
  • Voici (13th, -2): a slight deterioration in INP, which affects interaction smoothness on certain pages.
  • L’Internaute (16th, -3): decline linked to a drop in CLS, with about 5% of users moving into the orange zone, affecting reading comfort.

In the media sector, user experience is a critical retention factor!
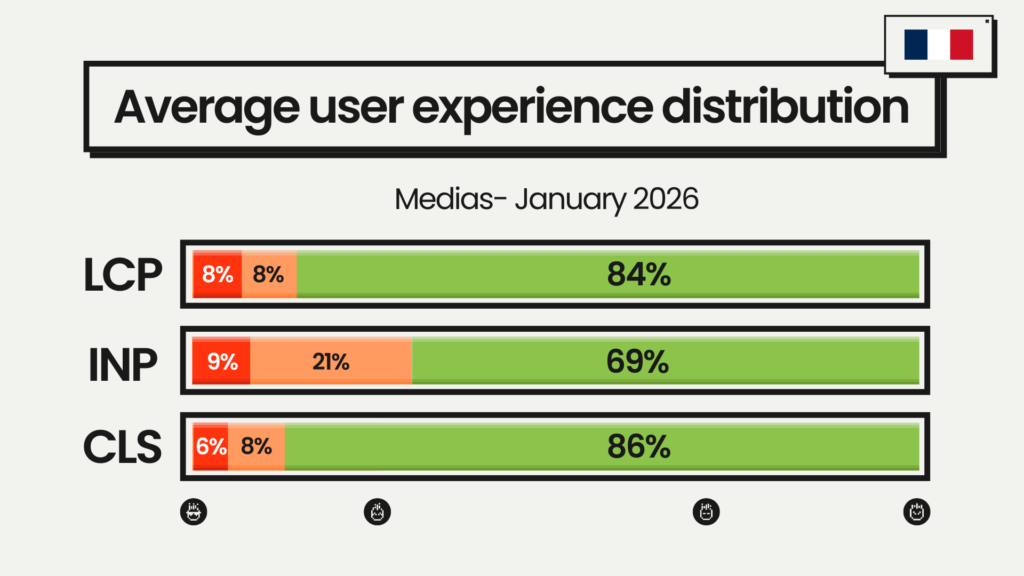
WebsiteRankingRanking
M-1
PX
Index
LCP
(% Good)
INP
(% Good)
CLS
(% Good)
BFMTV1 (0)191948790
Franceinfo2 (0)290938295
Actu3 (0)389937691
Le monde4 (0)488928779
Le Parisien5 (0)587877792

See the full ranking
WebsiteRankingRanking
M-1
PX
Index
LCP
(% Good)
INP
(% Good)
CLS
(% Good)
BFMTV1 (0)191948790
Franceinfo2 (0)290938295
Actu3 (0)389937691
Le monde4 (0)488928779
Le Parisien5 (0)587877792
Gala6 (0)687957183
Le Figaro7 (0)786956782
20minutes8 (2)1086878084
L’équipe9 (6)1586907684
Ouest-France10 (-1)985937779
Le journal des femmes11 (-3)884837386
programme-tv.net12 (0)1284876596
Voici13 (-2)1184876492
Femme Actuelle14 (2)1681836093
marmiton.org15 (-1)1481796590
L’internaute16 (-3)1381826877
Yahoo17 (0)1776846396
Dailymotion18 (0)1867645774
Youtube19 (0)1945322767
📊 Where does the media ranking stand this month?
 

Average user experience distribution – media

On average:

  • 84% of users enjoy a good LCP (first content load)

  • 69% experience good interactivity (INP)

  • 86% benefit from good visual stability (CLS)

The sector remains generally strong:

  • 42% of sites achieve a PX Index over 90

  • However, only a minority fully meet all Core Web Vitals:

    • 11% validate all 3 Core Web Vitals

    • 89% meet the green threshold for LCP → loading is largely under control

    • 42% meet the green threshold for INP → interactivity remains the biggest challenge

    • 89% meet the green threshold for CLS → visual stability is mostly solid, with some room for improvement

Maintaining these levels, rather than chasing occasional peaks, will be key to ensuring a smooth reading experience.


Travel: Performance of the most visited travel websites

Comparison engines, booking platforms, and transport operators must deal with complex user journeys, high functional density, large volumes of data, and highly variable traffic peaks depending on the season. In this context, ensuring a smooth and stable experience for the majority of users remains a challenge.

This ranking highlights a sector where performance is progressing slowly, and where gaps remain significant compared to other verticals.


🏆 TOP 3: TRAVEL LEADERS

  1. 🥇 easyvoyage (1st, stable)
    Maintains its lead with a PX Index of 89. The site stands out for a well-balanced experience, with a large majority of users in the green on LCP, INP, and CLS, a rare level of maturity in the sector.

  2. 🥈 ViaMichelin (2nd, stable)
    Confirms its robustness, supported by excellent visual stability. However, INP remains more fragile, limiting further PX Index progression.

  3. 🥉 SNCF Connect (3rd, +1)
    Gains a place thanks to minor optimisations, with +2% of users in the green on LCP and +1% on CLS, reflecting a progressive improvement in overall experience.


📈 ON THE RISE:

  • fr.hotels (10th, +2)
    Sees a notable rise due to combined improvements in CLS and INP (+2%). These gains add 5 points to the site’s PX Index.
  • Airbnb (13th, +2)
    Improves thanks to a +5% increase in users enjoying a good experience on LCP, enhancing initial content access, a key point in search and booking journeys.

These two players show that consistent, measured effort is enough to stand out in a historically slow-moving sector.


🔻 DECLINES:

No site experienced a marked decline this month.

WebsiteRankingRanking
M-1
PX
Index
LCP
(% Good)
INP
(% Good)
CLS
(% Good)
easyvoyage1 (0)189948594
viamichelin2 (0)284915195
sncf-connect3 (1)481808283
tripadvisor4 (-1)381837679
mappy5 (0)576765887

See the full ranking
WebsiteRankingRanking
M-1
PX
Index
LCP
(% Good)
INP
(% Good)
CLS
(% Good)
easyvoyage1 (0)189948594
viamichelin2 (0)284915195
sncf-connect3 (1)481808283
tripadvisor4 (-1)381837679
mappy5 (0)576765887
abritel6 (1)774796882
trivago7 (-1)674804081
viagogo8 (1)971736875
liligo9 (-1)870625571
fr.hotels10 (2)1270646679
thetrainline11 (-1)1069823664
ouigo12 (-1)1168824449
airbnb13 (2)1563614661
kayak14 (-1)1363685149
skyscanner15 (-1)1462614068
all accor16 (1)1760594977
booking17 (-1)1658625593
opodo18 (0)1854514146
airfrance19 (0)1952562757

📊 Where does the travel ranking stand this month?
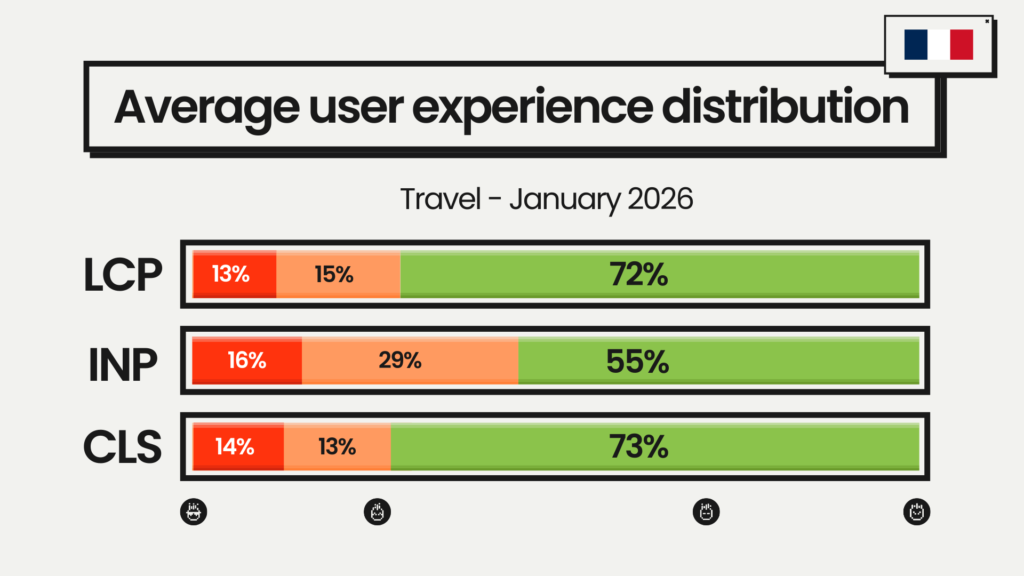
Average user experience distribution – travel

On average:

  • 72% of users benefit from a good LCP (initial content load)

  • 55% enjoy good interactivity (INP)

  • 73% have good visual stability (CLS)

❌ The travel sector remains the most behind among the major verticals analysed.

No site exceeds a PX Index of 90, and the average PX Index is capped at 69 — compared to 80 for e-commerce and 82 for media.

  • 16% of sites meet all 3 Core Web Vitals

  • 47% reach the green threshold for LCP

  • 16% reach the green threshold for INP

  • 52% reach the green threshold for CLS

There are, however, slightly positive signals: some platforms are working on targeted optimisations, particularly for initial load and visual stability. INP remains the primary barrier to faster user experience improvements in the sector.

Web performance is no longer just about an isolated technical metric: it’s about the site’s ability to continuously offer a good experience to the majority of users.


This month’s variations, between sectors and between individual sites, show that a few targeted optimisations can drive quick progress, but sites can just as quickly fall back if they ease up on their efforts. Meeting Google’s green threshold is a step; maintaining it is the real challenge.

In this context, web performance becomes a strategic lever in its own right, at the crossroads of UX, SEO, and business. Improving the proportion of users in the green means reducing friction, securing journeys, and creating long-lasting competitive advantage.

Where does your site rank?

Analyse your site’s performance in 1 click and compare yourself to the leaders in your sector:

  1. ✅ Assess the percentage of users enjoying a good experience
  2. ✅ Get your PX Index
  3. ✅ Compare yourself to your competitors and sector

And what better way to kick off this effort than with the support of web performance experts?
Fasterize is here to guide you with concrete solutions to make your site faster, more stable, and more responsive.

⭐ See you next month for another deep dive into the web experience of France’s top sites!

Sommaire
Test your site's performance in 1 click

Discover other articles…

product thumbnail class concu

Discover Fasterize’s new Competitive Ranking Dashboard. Compare your performance with competitors and track your PX Index month after month.

Classement UK

Monthly ranking of the most visited websites in the uk: travel, media, ecommerce. Based on Vitals Core Web, metrics that evaluate several aspects of your

Blog launch

From January 2026, our methodology will evolve with the Performance Experience Index (PX Index). This score is designed to go beyond technical compliance and better

Boost your site speed now with EdgeSpeed!