


Better than a good score? A better experience.
For over a decade, we’ve published monthly reports on the web performance of the most visited websites in France. These rankings, based on data from the Chrome UX Report (CrUX) and Google’s Core Web Vitals, have become a reference point for assessing the market’s maturity in terms of performance.
But over time, one thing has become clear: meeting Google’s recommended thresholds is no longer enough. These thresholds are calculated at the 75th percentile, which means they only reflect part of the user experience, potentially leaving 25% of sessions out of the equation.
At Fasterize, we believe a fast website shouldn’t just be fast for most users, it should be fast for all of them.
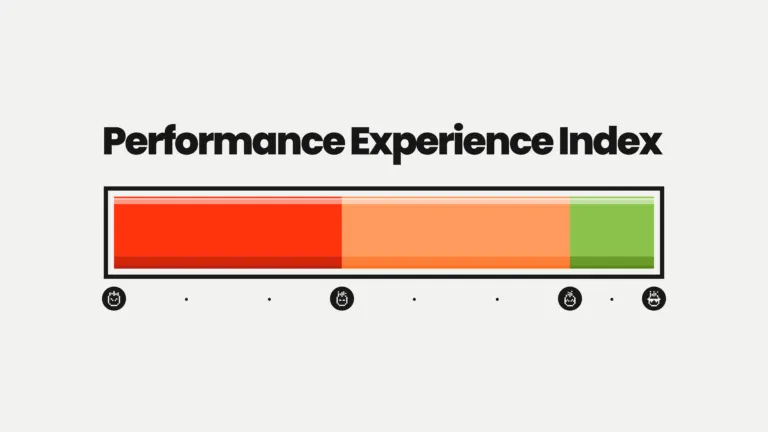
That’s why, starting January 2026, we’re evolving our methodology with the launch of the Performance Experience Index (PX Index) : a scoring model designed to go beyond technical compliance and better reflect the real experience delivered to all users.
Why update this historical scoring model?
From technical benchmark to experience-led measurement
Until now, performance was primarily assessed through a percentile-based lens (p75). A technical approach, certainly—but one that only partially reflected real-world user experience. With the PX Index, we’re introducing a major shift in perspective: the score now reflects the proportion of users enjoying a good experience, rather than relying on a single aggregated value.
In practical terms, improving your score no longer means shaving off a few milliseconds on a metric—it means reducing the number of users subjected to a mediocre or poor experience. It’s this shift, not marginal optimisation, that drives real value for users and businesses alike.
By measuring the actual share of satisfied users, the PX Index exposes friction points that traditional averages or percentiles tend to conceal. While legacy scores often smoothed over disparities and hid degraded sessions (up to 25% of the audience), the PX Index makes them visible, measurable, and actionable.
This makes the score not only more demanding and fairer, but also far more accurate in reflecting the reality experienced by your users.
What’s changing in the PX Index?
Beyond this new perspective, we’ve expanded the scope of metrics and refined their weighting.
- A broader set of metrics
The PX Index now covers the entire user journey, from server response to on-screen interactions:
- LCP (Largest Contentful Paint) : visual loading of primary content
- CLS (Cumulative Layout Shift) : layout stability
- INP (Interaction to Next Paint) : interactivity and responsiveness
- FCP (First Contentful Paint) : initial load perception
- TTFB (Time To First Byte) : server response & crawlability (new)
Adding TTFB gives a clearer picture of performance at the technical foundation, from crawl efficiency to user experience and SEO impact. The PX Index is now truly end-to-end.
- Weighted to reflect user impact
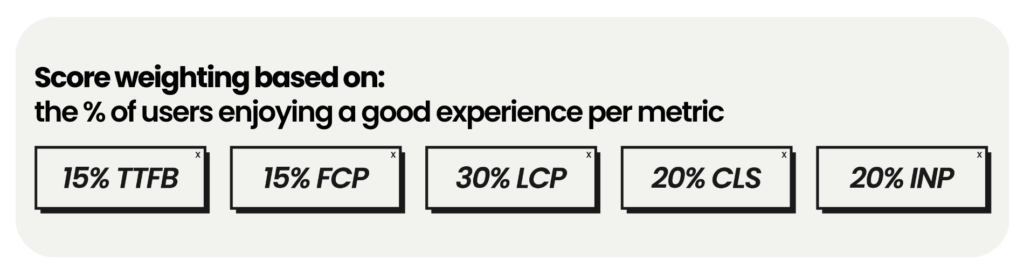
Not all metrics affect users equally, so we’ve applied a transparent weighting system:
-
LCP (30%): This is the most decisive metric, as it reflects both how quickly the main content is displayed and the pace at which the page is visually built.
-
CLS (20%): Measures visual stability, a fundamental pillar of a smooth experience, without unexpected layout shifts.
-
INP (20%): Represents the site’s ability to respond quickly to user interactions. Even after loading, a poorly responsive page significantly degrades the experience, particularly on mobile.
-
FCP (15%): The first visual signal perceived by the user. It plays an important role in the feeling of speed, but on its own is not sufficient to guarantee a good experience if the main content takes too long to appear.
-
TTFB (15%): Captures the server-side dimension. Although not immediately visible, it directly influences FCP, LCP and perceived speed, and also has an impact on SEO and crawl efficiency.
The PX Index as a common strategic tool for teams
The PX Index has been designed as a steering tool — not as a scoring system for handing out gold stars or black marks. Expressed on a simple 0 to 100 scale, it provides a clear, shared benchmark. It creates a common language between technical, product and business teams, helping to prioritise actions, track progress over time (rather than at a single point), and assess your position objectively against your competitors and your sector.
For brands, the PX Index offers a clear view of the actual experience delivered to users and allows them to:
-
Measure that experience beyond theoretical compliance with the Core Web Vitals
-
Benchmark themselves more fairly against the market and their competitors
-
Guide investment decisions towards the most impactful actions
The score acts as both an early warning signal and a prioritisation tool, highlighting where user experience may be holding back overall performance.
For technical teams, the PX Index provides a more accurate reading of the real impact of their optimisations. By taking into account all users, rather than relying on a single percentile, it :
Why the PX Index meets today’s challenges
Web performance is no longer a secondary concern. It has become a strategic factor for quality, visibility, and competitiveness.
-
Because performance issues are no longer tolerated
We’ve entered an era where a slow or unstable experience isn’t just frustrating : it’s a red flag for users, product teams, and business leaders alike.
What was once considered a technical issue is now clearly recognised as a major barrier to conversion, engagement, and adoption. The days of leniency are over: performance is now a non-negotiable prerequisite.
-
Because AI-driven search increases technical pressure
AI engines (such as Google SGE, Perplexity, ChatGPT) consume the web differently — at scale and in near real time. A high TTFB, excessive JavaScript, or poor crawlability can easily exclude a site from being surfaced in generated answers.
As shown in research by Salt Agency, technical performance now plays a key role in visibility within AI environments.
-
Because every second counts : to act and to convince
With tight budgets and stretched teams, companies need tools that help identify priorities, move fast, and demonstrate impact.
The PX Index supports this need by offering a clear, actionable benchmark : one that helps direct decisions towards the changes that unlock both user experience and business performance.
Measure your PX Index and see how you compare
The PX Index enables you to assess the real quality of the experience your users are having, with a scoring framework designed to support both SEO and business decisions.
It helps you benchmark against your industry and competitors, track your progress over time, and prioritise the actions that truly matter. Test your score in seconds with the Fasterize simulator:


