


In November 2019, Google introduced a Speed tab in its Search Console. Initially, it measured website speed using two metrics: First Contentful Paint (FCP), which evaluates when the first elements appear in the browser, and First Input Delay (FID), which measures the time between a user’s first interaction with a page and the browser’s ability to respond.
Since then, Core Web Vitals have emerged, replacing the Speed tab with a Core Web Vitals tab. This article explains how data in the Search Console is calculated and how to leverage it to optimize your website’s performance.
Faster web pages to boost conversions and SEO
Recognizing that loading speed is critical for user experience, Google has developed multiple tools to measure performance.
Loading speed is the number one UX factor for both desktop and mobile users. According to a Google study, bounce rates increase by 32% when page load time grows from 1 to 3 seconds, and by 106% when it rises from 1 to 6 seconds.
Slow pages pose risks to conversions, potentially leading to significant losses. For example, a study in the eCommerce retail sector revealed that improving speed by 20% could generate an additional 1.6 million euros annually for High Tech websites and 1.5 million euros for Fashion websites.
Moreover, speed became a SEO signal with Google’s Page Experience update in 2021. Google incorporated Core Web Vitals into its algorithm—three metrics that measure UX quality:
-
Largest Contentful Paint (LCP): Evaluates loading performance.
-
First Input Delay (FID): Assesses interactivity.
-
Cumulative Layout Shift (CLS): Measures visual stability.
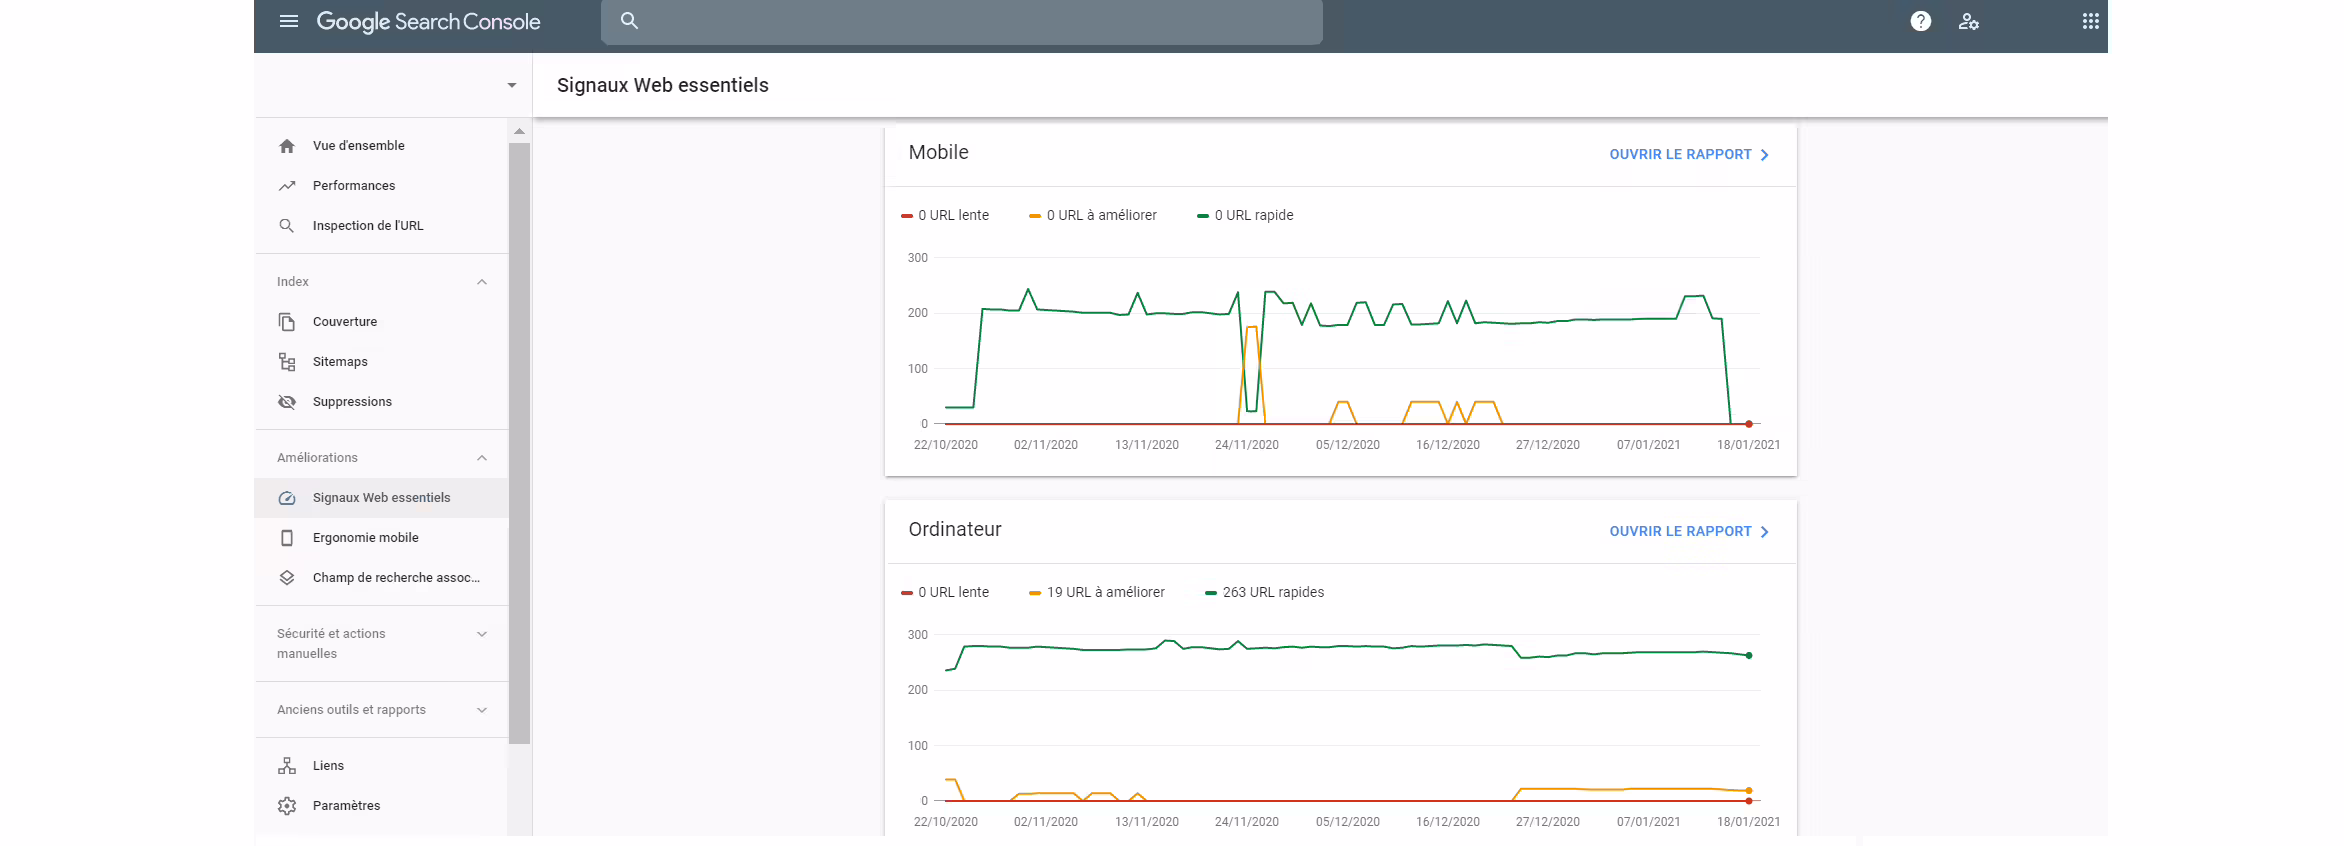
These metrics are displayed in the Core Web Vitals report within the Search Console.
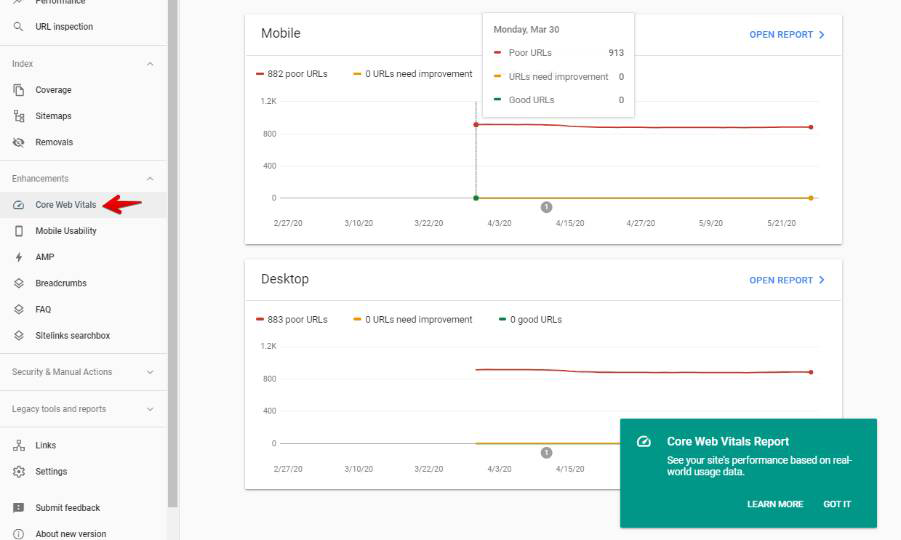
Understanding the Core Web Vitals Report in Search Console
The report categorizes web pages into three groups for mobile and desktop:
-
Green (Good): Pages considered fast.
-
Orange (Needs Improvement): Pages requiring enhancements.
-
Red (Poor): Pages with significant speed issues.
The data is displayed as chronological graphs, enabling performance tracking over time.
Google’s classification into Good, Needs Improvement, and Poor is based on predefined thresholds for each Core Web Vital metric, evaluated using real-user data from the Chrome UX Report (CrUX). Data reflects user behavior exclusively on Chrome browsers, assessed at the 75th percentile.
Mobile vs Desktop analysis
Google separates mobile and desktop data due to differences in browsing conditions—Wi-Fi connections on desktops versus potentially weaker mobile networks. As a result, achieving fast speeds on desktop may be easier, despite Google’s Mobile-First indexing approach.
Navigating the Core Web Vitals Report
To analyze performance:
-
Select the property (domain or subdomain) you want to monitor.
-
Click “Open Report” to view diagnostics and improvement suggestions.
-
Click specific issues to see affected pages and optimization recommendations.
-
Check example URLs to identify patterns and prioritize fixes.
Google evaluates groups of pages using the 75th percentile. For example, a 200 ms FID means 75% of users experienced an FID below 200 ms. Pages are categorized based on the worst-performing Core Web Vital metric.
Comparing Core Web Vitals and PageSpeed Insights
The Search Console Core Web Vitals report monitors overall site performance, while PageSpeed Insights focuses on specific URLs. A high PageSpeed score does not guarantee a good Core Web Vitals rating, as Google prioritizes the lowest-performing metric for evaluation.
Pros and cons of the Core Web Vitals Report
Advantages:
-
Relies on real-user data (e.g., FID requires real interactions).
-
Provides long-term SEO performance tracking.
Limitations:
-
Only includes Chrome users, potentially overlooking performance on other browsers.
-
Requires sufficient traffic; low-traffic sites lack CrUX data.
-
Threshold-based classification may not always align with user perceptions of performance.
Conclusion
Google’s Core Web Vitals report is a valuable tool for assessing website performance and understanding its UX and SEO implications. However, for more granular insights and optimization strategies, consider using additional web performance monitoring tools and methodologies.


