


In the first part of our special 2019 sales report , we took stock of the loading speed of e-commerce sector sites by comparing performance before and during the sales. Let’s now focus on a selection of retail sites whose webperf actions and their impact we have analyzed.
3 Suisses – change is now
With an average Speed Index of 9,231 in December 2018 vs. 4,327 during the sales, 3 Suisses seems to have implemented a web performance project that paid off at the end of 2018. This is particularly clear in the comparison of the filmstrips below, which represents the stages of loading the page (the first day of the sales is at the top, and the month of December at the bottom. You can click on the image to see the details):
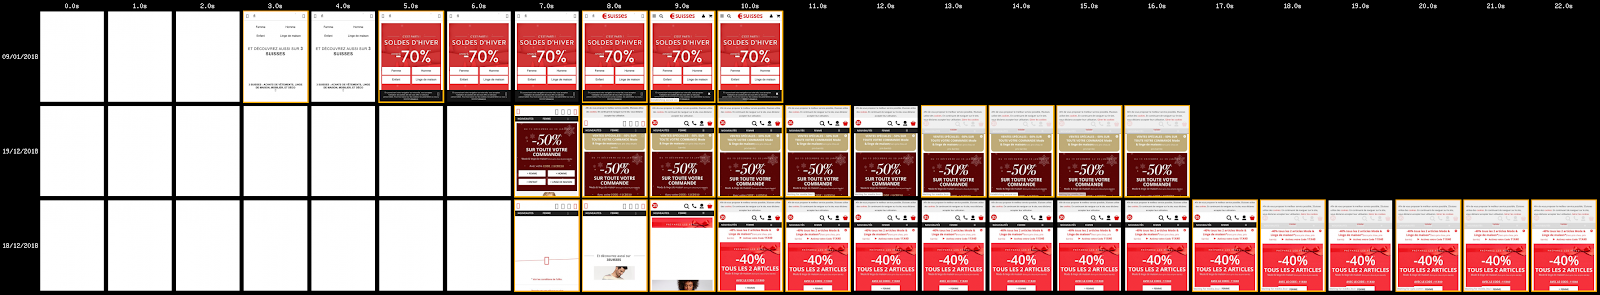
Changes occurred between December 18th and 19th, mainly on the weight of images (the weight of pages dropped by 43% between December and January). For example, on the homepage, they went from 3.5MB (or 6MB uncompressed) to 1.25MB.
However, while these commendable efforts have improved the Speed Index, the Start Render has not changed because the rest has not really been optimized.
- 12/18/2018:
- 12/19/2018:
The code has changed, but also the infrastructure by switching from a CDN to classic Varnish servers, and we also note a switch from HTTP/1.1 to HTTP/2 (maybe even a spring cleaning ahead of time with a change of host?). Then, between December 19 and January 9, 3 Suisses seems to have deployed a new version of its site. What tipped us off? The home page has been completely rewritten and not just the images this time. There is little doubt: this must indeed be a redesign.
This was enough to make the improvement of the Speed Index felt largely due to the Start Render which gains 2 seconds. NB: the real gain is slightly less important because in the previous versions, our measurement tool took into account OCSP requests which are now absent from the new version of the site.
Following this overhaul, the LightHouse score increased from 24 to 78, and all these optimizations benefited the Time To Interactive (TTI) which decreased accordingly.
Let’s applaud these efforts, although there is still room for further optimization.

As they say in Switzerland: “Breaking the watch does not stop the passing of time”
Sandro and Minelli – the GIF killed me
Sandro recorded an improvement in its TTI during the sales, but not enough to claim victory: it went from 21 to 16 seconds, or 24% less, which is still significant (the average TTI over this period is 13,875).
For the sales, we have notably noticed a clean sweep of animated GIFs: exit the dress at 4MB here and the sequins at 6MB here .
Minelli also took care to eliminate the animated GIFs that made the homepage very heavy:
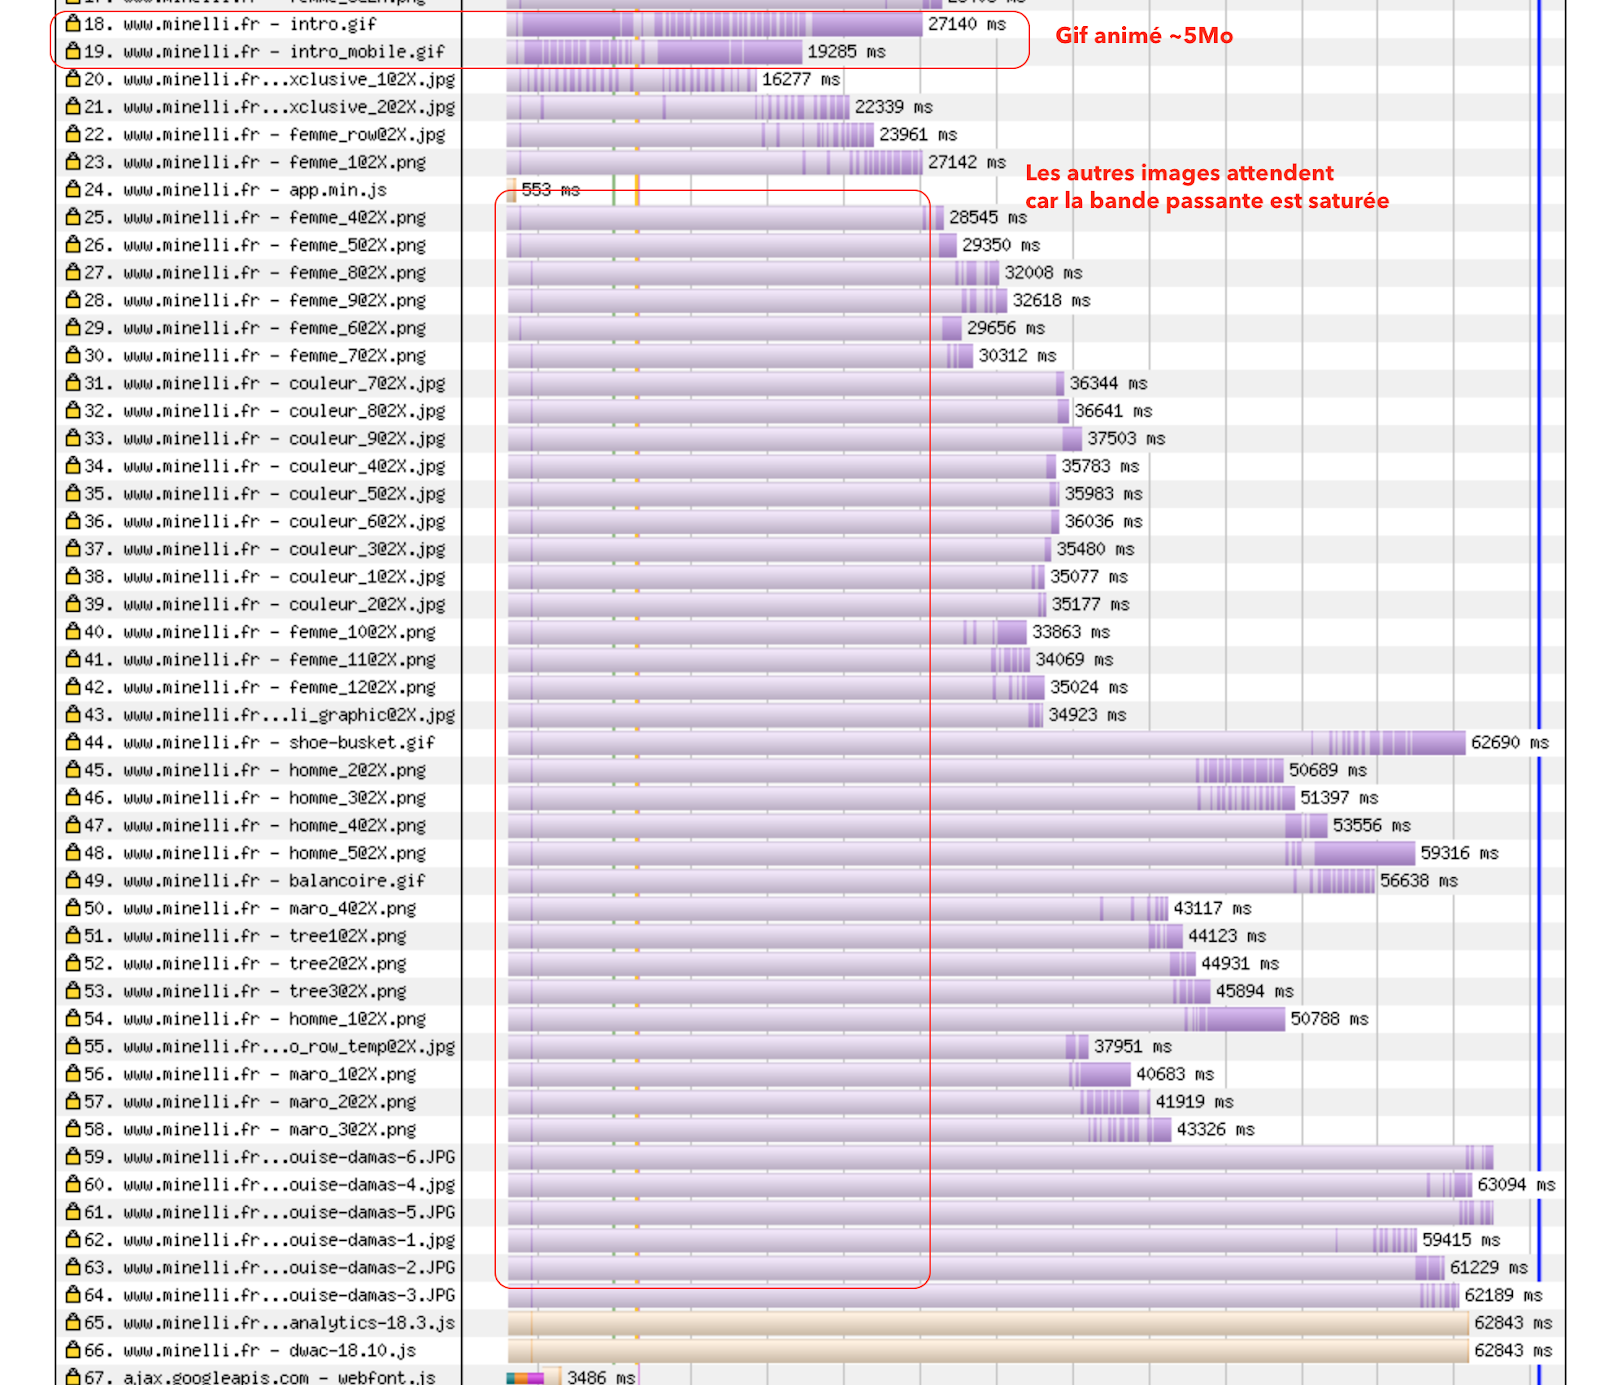
We can clearly see here that the bandwidth (not high in 3G) was totally saturated:
Why? Because of a strange phenomenon: this “double GIF” loaded in both desktop and mobile versions regardless of the connection, device, browsing conditions… and whose terrible effects we can see here . For mobile users, you really had to hang on tight. And when you know that 53% of visitors to a mobile page leave if it takes more than 3 seconds to load… Fortunately , we could breathe a little easier from the start of the sales .
For all intents and purposes, and this is no longer a secret to many people, MP4 allows you to reduce the weight of animations to a few hundred KB, or around 5% of the initial weight… It’s a shame to deprive yourself of it.

GIFs are heavy
Le Slip Français – the pictogram of hell
We noticed improvements on the Slip Français website during the sales. This site started with a Speed Index of 24,000 in December 2018 and the average weight of the pages was then 34MB. 34MB? How? Why? Is it a bird? Is it a plane? No, it’s SuperPicto ! Even a squadron of pictograms each weighing more than 10MB:

SuperPicto has since been put on dry bread and water, returning to a form weight of 640KB. But with a little push, it could even go down to 2KB if it were in SVG.
A beautiful story that reminds us that we can put whatever we want in place: CDN, competition templates, best practices in the world… the devil is in the details (and here in the pictograms ).
How to avoid this kind of disappointment? Well, by automating image optimization . This feature is one of the many benefits our platform offers. Saving time, effort, and improving the user experience is so simple.
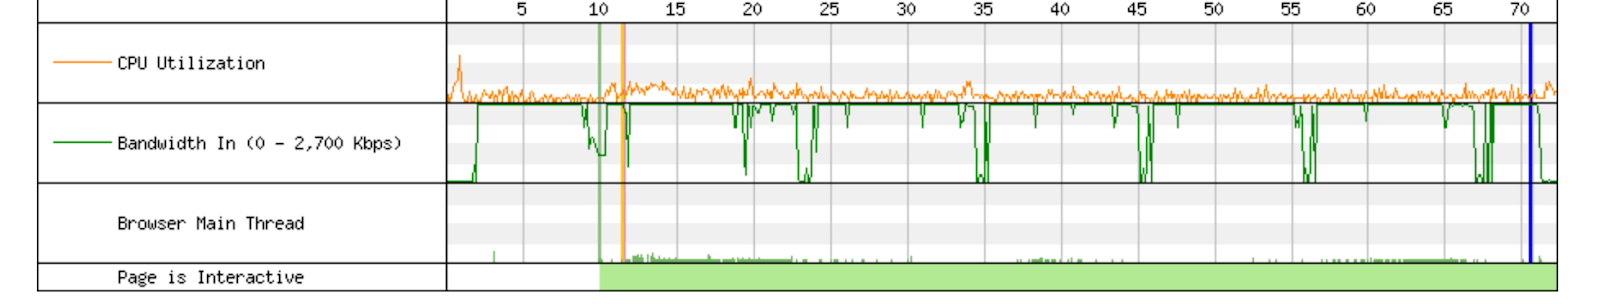
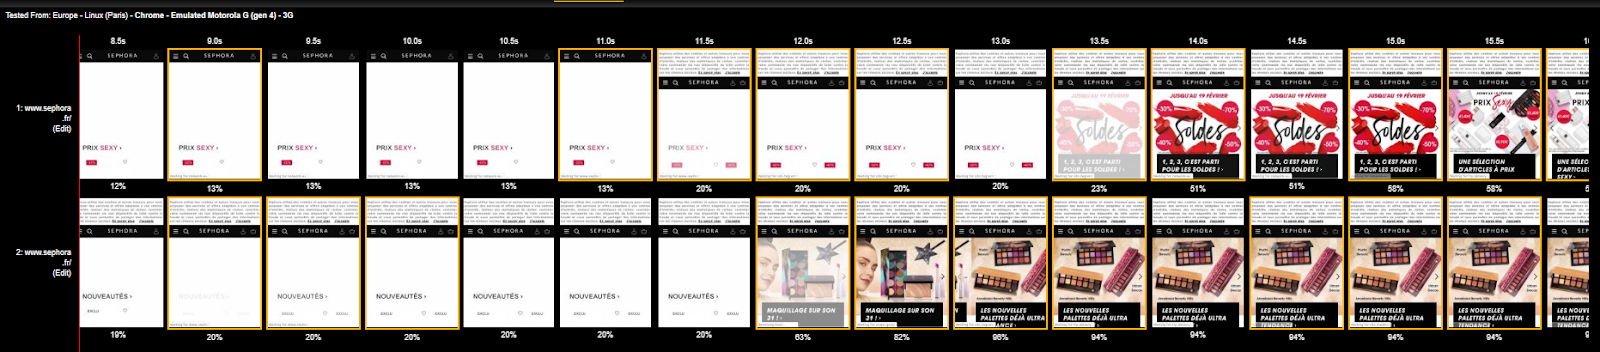
Sephora – don’t push grandma into the nettles
We observed +16% on the Speed Index of the list page during the sales, +18% for the product page and… +46% for the home page! However, for the latter, the problem seems to come from the way of calculating the Speed Index if we look more closely at the two filmstrips below. Let’s keep in mind that the Speed Index like the Time To Interactive are metrics that need to be put into perspective, and whose interpretation can be difficult in some cases.
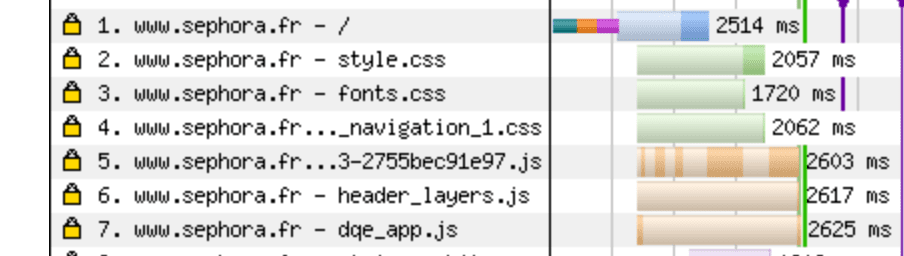
So what happened? Taking out our detective lens, we see that Sephora disabled the HTTP/2 Push feature between December 26th and January 9th.
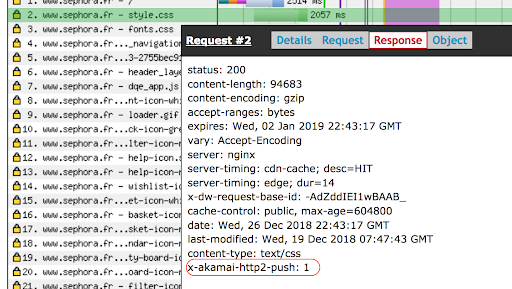
As a reminder, with HTTP/2 Push, some critical JS and CSS are pushed by the server before the HTML is served, and therefore arrive earlier, as we can clearly see in this excerpt from Sephora’s Waterfall:
And this is confirmed by the headers returned:
While without Push…:
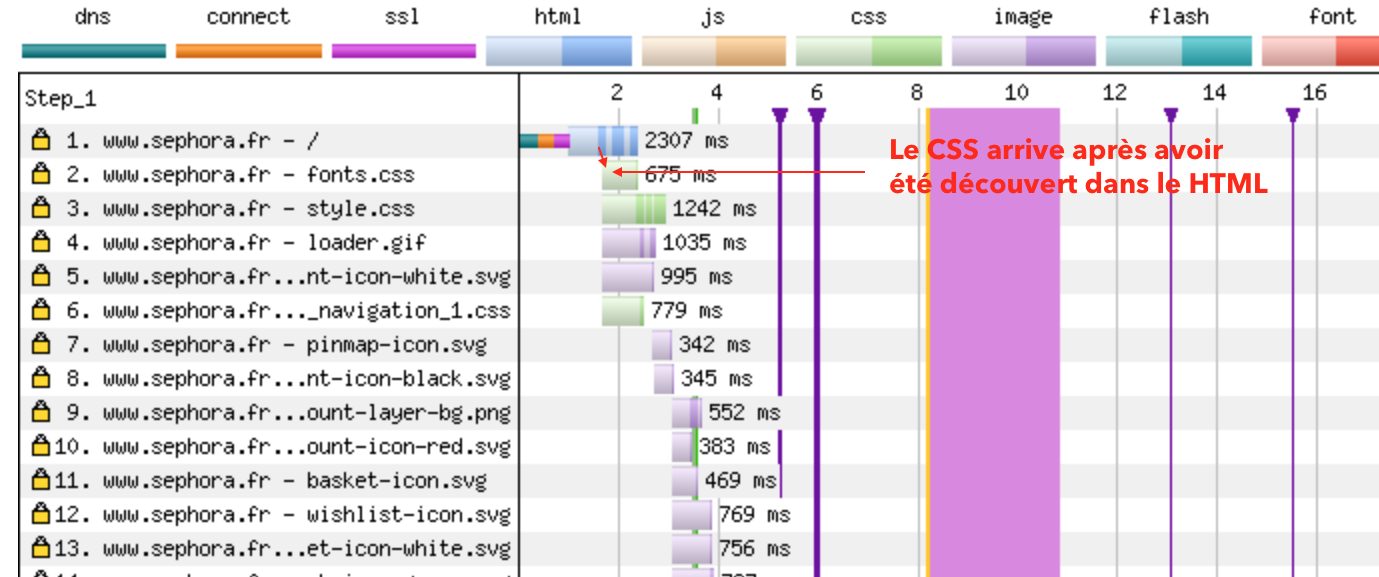
Push is supposed to be an optimization, yet we can see that Start Render happens later when it is enabled. Thus, Push can ultimately prove counterproductive, which would explain why it was disabled.
As Pirelli so rightly said in one of its commercials: without control, power is nothing. We’ll let you think about it.

Are you measuring the impact of your web performance on your business? Discover here how Petit Bateau increased its conversion rate by 10% thanks to Fasterize.


