


Having seen the details of how the PageSpeed Insightsscore is calculated and what it means, let’s look at the rest of the results to see if the recommendations in the Opportunities and Diagnostics section are relevant, and if they should be applied to optimize your frontend and user experience.
What data are displayed on the PageSpeed Insights results page?
Field Data
Google’sPageSpeed results page gives an overview of the Core Web Vitals of the tested page for mobile and desktop, indicates the Field Data, and also offers the possibility of observing these metrics for the domain of the tested page ( Origin tab). Finally, a sidebar describes the conditions under which this data is collected.
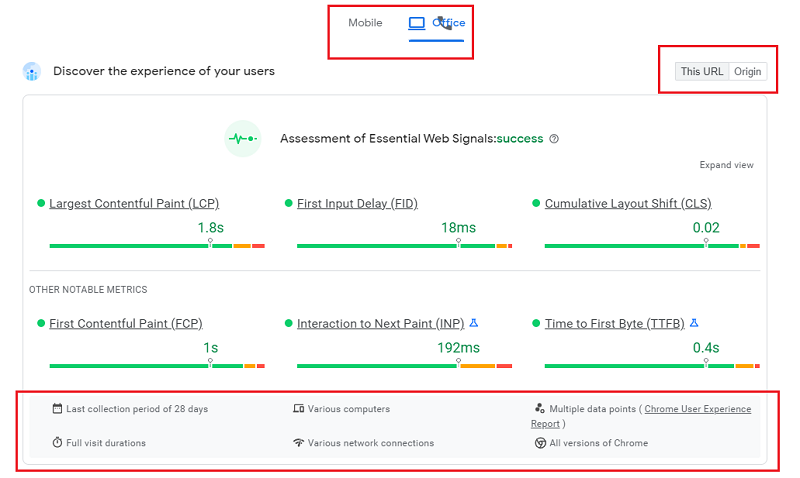
The results in this first section are taken from CrUX data (a panel of real Chrome users) collected over 28 days, with the option of observing them for the URL tested, or for the domain in the Origin tab .
Please note,however, that they do not reflect the best possible experience based on the 75th percentile –in other words, 75% of users have an experience of a higher quality than the times reflected by these metrics (harsh but fair, as we told you).
Google could have chosen to indicate a median, but in our opinion, it’s also interesting to show extreme values as an incentive to optimize loading speed.
Even if the data is not the most representative of all users, it does take into account the most critical cases, which should not be ignored. In this respect, the complementary visualization of the distribution of values divided into 3 groups “fast / medium / slow” is interesting.
Please note that the results for Field Data in this section are not the same as those in the following section, which is based on Lab Data, and which we will discuss in the next section. You’ll see why the results aren’t identical: they’re the same metrics, but measured using different methods.
You should also be aware that if your site’s audience is confidential and it’s not part of the CrUX panel, Google won’t collect all the field data, and you won’t have access to all the information in this section. You may then see this message appear:

Lab Data
This section shows the performance score and “lab” data calculated by Lighthouse, which extrapolates results from a native connection via an algorithm (unlike WebPageTest, which simulates a connection). This is therefore synthetic data , which explains why the test results for some indicators are not the same as in the previous Field Data section (which is based on RUM data), with the added margin of error induced by this extrapolation of results.
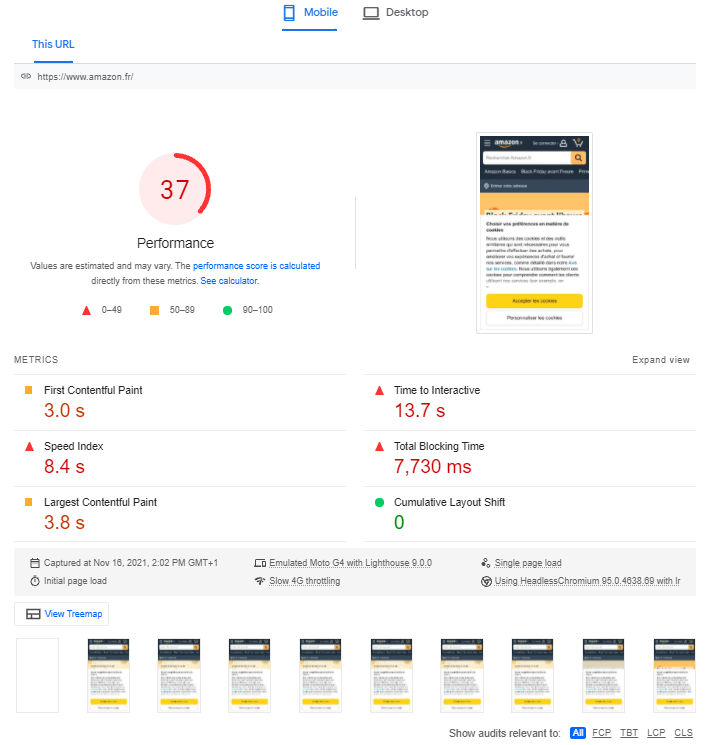
As we also saw in our previous article on PageSpeed Insights, these results are weighted to calculate the score between 0 and 100, which is to be observed with hindsight; the same applies to the advice given in the following sections of the results page (Opportunities and Diagnostics), which concern only the page whose URL was entered for the test. This recommendation section suggests improvements that may make sense, but without developing the conditions for implementation and, above all, without any systemic vision. What’s more, the estimatedsavings are very optimistic, not to say unrealistic, based on the tests we’ve carried out. For example, recommendations on image compression do not take perceived quality into account:
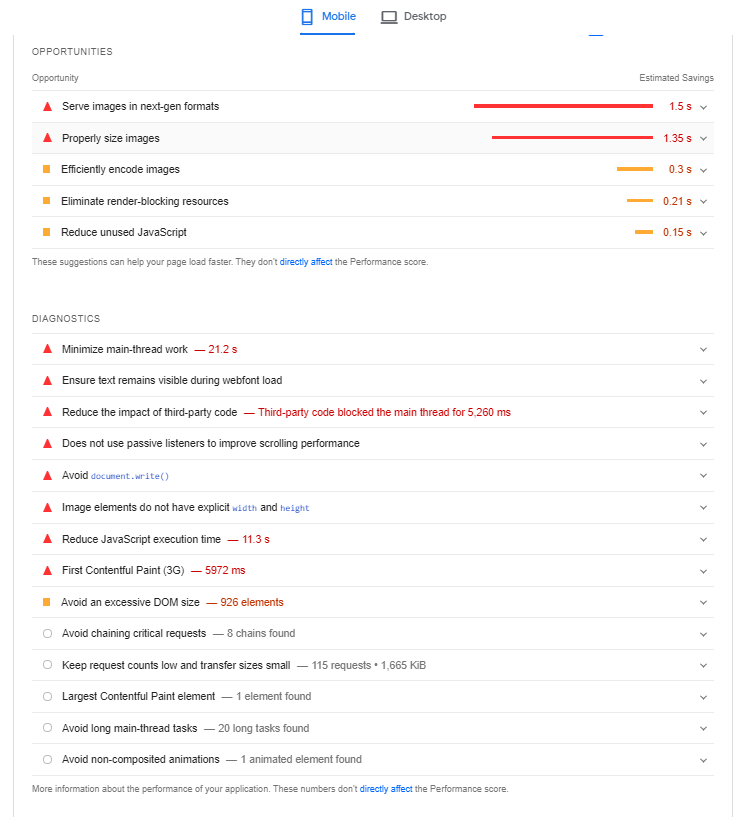
Note that just above the Opportunities section, you can choose to display all recommendations, or sort them by webperf metric:

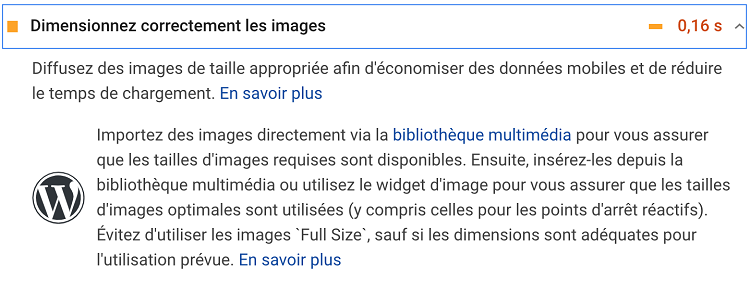
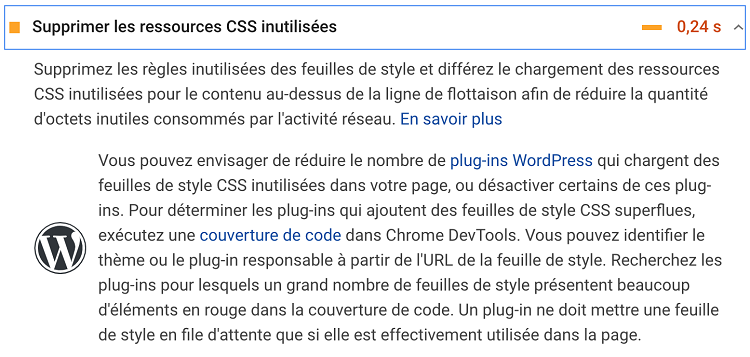
Google’s PageSpeed Insights also detects the CMS of the web page being tested and can offer specific additional information, for example here for WordPress:
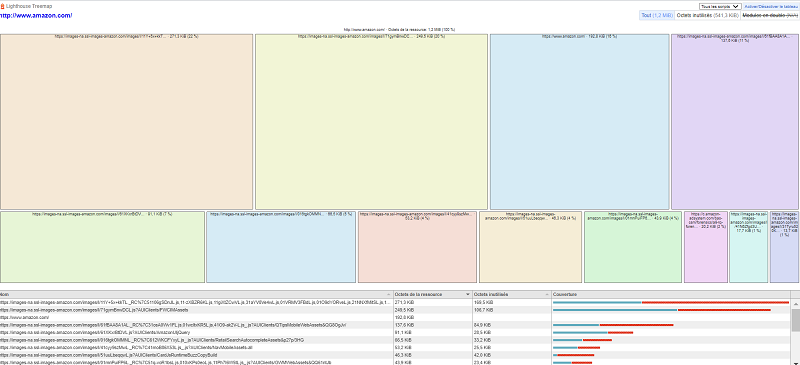
Finally, under the Laboratory data section, you’ll see a “View proportional map” button that lets you visualize the weight occupied by the various resources on the tested page:
What can Fasterize do to improve the points marked in red, and more generally to optimize the PageSpeed Insights score?
As you can see in the screenshots above, the items on the list appear in orange or red if they need to be optimized.
These may be good practices that you really should apply, but they may also be tips that you can’t follow, as you don’t necessarily have control over the points to be corrected.
This is also true for our customers who benefit from our platform’s automatic optimizations, as Fasterize’s scope does not cover 100% of the points listed by PageSpeed Insights.
For example, if the tool recommends optimizing Third Parties, it is not possible to intervene since these scripts come from third-party publishers and can hardly be optimized by our engine.
Here’s a summary of what Fasterize can do to improve PageSpeed Insights’ web performance recommendations. For more details on the actions to be taken, please visit our support page ; and to continue exploring the subject, you can also consult the presentation from our webinar dedicated to PageSpeed Inisghts.
| Lighthouse error | Fasterize optimization |
| Page does not use HTTPS protocol | Yes |
| Does not redirect HTTP traffic to HTTPS | Yes |
| Current page does not return code 200 in offline mode | No |
| Page does not load fast enough on mobile networks | Partially |
| Reduce server response time (TTFB) | Yes |
| Reduce JavaScript execution time | Partially |
| Preload key requests | Yes, manually |
| Connect in advance to desired origins | Yes, manually |
| Make sure text remains visible while loading Web fonts | Yes |
| Distribute static elements with efficient caching rules | Yes |
| Avoid heavy resource weights | Yes |
| Defer off-screen images | Yes |
| Eliminate resources that block rendering | Partially |
| Reduce CSS resource size | Yes |
| Reduce the size of JavaScript resources | Yes |
| Remove unused CSS resources | In progress |
| Distribute images in next-generation formats | Yes |
| Encode images efficiently | Partially |
| Enable text compression | Yes |
| Correctly size images | Yes, manually |
| Use video formats for animated content | No |
| Avoid excessive DOM size | No |
| Page does not use HTTP/2 protocol for all resources | Yes |
| Page does not use passive event listeners to improve scrolling performance | No |
| Invalid robots.txt file | Yes |
In conclusion, 2 points to remember about PageSpeed Insights, which is a good tool, but…
- the rating should be put into perspective;
- there’s no substitute for the eye and opinion of an expert to know which optimizations to apply and how!
To find out in concrete terms how Fasterize can
improve your loading speed on mobile and desktop :


