


To complete our post on waterfall, we’re publishing here a translation of theoriginal article by Matthew Hobbs on his blog nooshu.com. The original article is regularly updated, and we’ll be adding new elements as we go along. Please note that some of the links in this article are to original publications also in English.
I often read and analyze waterfalls on WebPageTest (WPT), but as I seem to have a chimpanzee memory (not goldfish, it’s a myth), I tend to forget certain details and their meaning. So I’ve decided to put together a lot of information in this article, which I’ll be able to refer back to.
If it’s useful to you too, or you think I’ve forgotten something, please let me know.
The basic interface
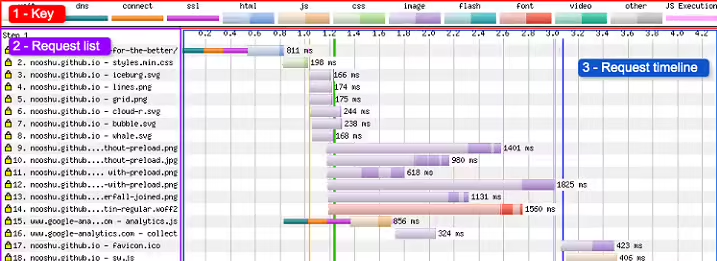
Here’s the basic waterfall interface , for which we’re going to detail each element:
1 – Key (captions)
Captions provide several types of information:
- Connection status (DNS resolution, connection establishment, TLS* negotiation)
- Type of resources requested (e.g. HTML, images, etc.)
- Various events (“wait“, JavaScript execution)
Each resource is represented by 2 colors, a light shade and a dark shade. The light color indicates when the browser requested the resource.
The darker color indicates when the resource is downloading.
For more details, I recommend this post by Pat Meenan.
The “wait” elementis new to WPT. It corresponds to the time elapsed between the moment the browser discovers the resource on the page and the moment it requests it from the server.
2 – Request list
This is the list of resources discovered by the browser on the page and the order in which they were requested. The request number is shown on the left, along with a yellow lock if the request is made via a secure connection (HTTPS).
3 – Request timeline
The timeline shows the time taken by each request along the horizontal (x) and vertical (y) axes. You can thus observe the life cycle of a request made by the browser: from discovery (“wait”) to the request, to downloading the resource.
Ideally, this timeline should be as short as possible, as this is the sign of good performance: the shorter it is, the faster the page loads for the surfer.
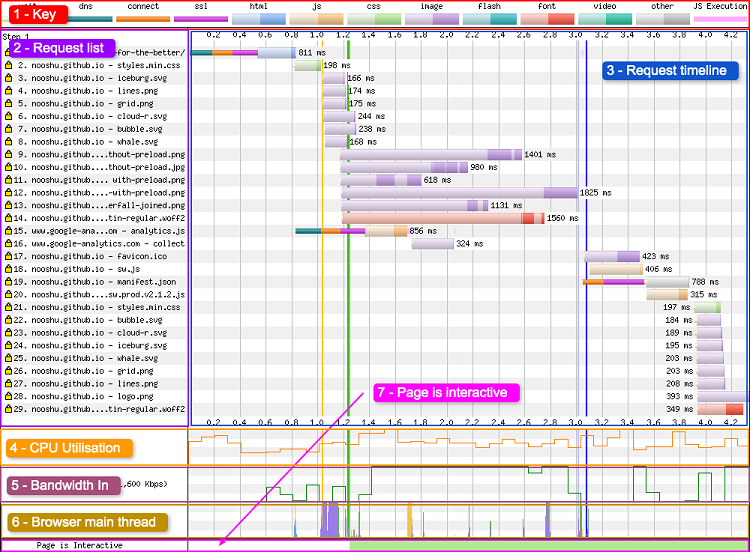
4 – CPU Utilization
This graph illustrates thebrowser’s use of thedevice ‘s CPU. It shows the amount of CPU used for the page under test at each stage, ranging from 0 to 100%.
5 – BandwidthIn
This indicator shows when data arrives at the browser. This graph allows you to distinguish between “useful” browser work phases and wasted time. Please note that the absolute scale can be ignored as it lacks precision. You can use the “Capture network packet trace (tcpdump)“optionin the Advanced tab of the WebPageTest home page if you want more precise results.
6 – Browser Main Thread
Here’s what each color means:
- Orange – Analysis, evaluation and script execution
- Purple – Page layout / rendering
- Green – Visual elements
- Blue – HTML analysis
By observing this graph, it is possible to detect whether the CPU is becoming a bottleneck.
7 – Page is Interactive
This graph shows when themain threadis blocked. The red blocks here, for example, indicate that it has been blocked for 100 ms (which will also prevent actions such as button clicks). Green indicates that the main thread is not blocked.
NB: it is still possible to scroll during the phases blocked in red, as scrolling is generally handled outside the mainthread by most browsers.
Vertical lines
Under the “Waterfall View” heading, you can see the captions corresponding to the vertical colored lines:

But what do they mean?
Start Render – Green
This is the end of the white page, the moment when the first pixels appear. The pixels can come from any element (background image, borders, etc.), not necessarily from relevant content. This measurement is obtained by analyzing videoframes captured during page loading.
RUM First Paint – Light green
This is the point at which the browser renders everything on the screen that is visually different from before navigation (i.e. the blank screen for WPT). This metric comes from the browser API, when the browser indicates that it is showing the first pixel. For this reason, this vertical line is only visible if the browser supports thePaint Timing API.
DOM Interactive – Yellow
This is when the browser has finished parsing the HTML, and the DOM is built. Unfortunately, this metric is not totally reliable.
DOM Content Loaded – Pink
This is when the HTML code is loaded and parsed, and the browser has reached the end of the document. All blocking scripts are also loaded and executed. At this point, the DOM is completely finalized.
On Load – Purple
This is the starting point for loading the window. All objects are in the DOM and all images and scripts have been loaded.
Document Complete – Blue
Onload is triggered and all static image content is loaded. Content modifications caused by JavaScript execution may not be included.
Horizontaltimings
Now let’s take a look at the timeline – or chronology – of requests (3). What does the horizontal block refer to and what does it contain? Well, if you click on one of the queries, you’ll see a pop-up with a lot of information, like this:
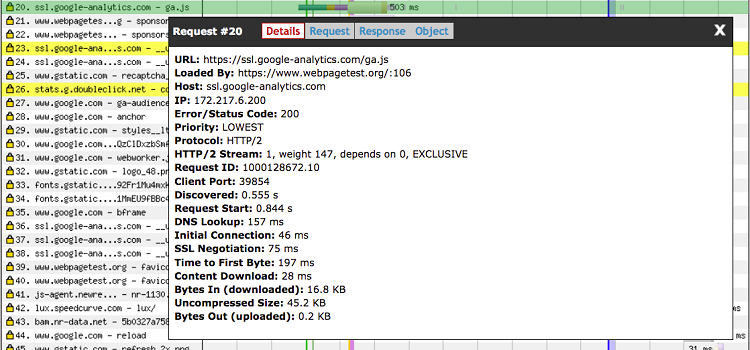
Let’s explore some of the different queries in this waterfall view.
Query 1 – HTML
In this case, the browser requests the HTML document. At the same time, it must also configure the connection to the server. In the request details, the following times are indicated:
- Discovered : 0.011 s
- Request Start: 0.116 s
- DNS Lookup: 27 ms
- Initial Connection : 25 ms
- SSL/TLS Negotiation : 43 ms
- Time to First Byte : 315 ms
- Content Download : 40 ms
I’ve annotated the request to show what each of these times correspond to:
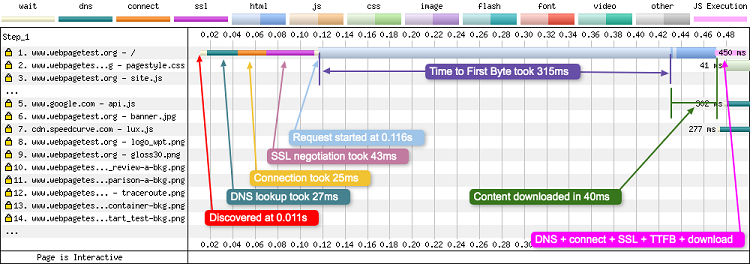
By adding DNS resolution, initial connection, TLS negotiation, Time to First Byte (TTFB) and content loading time, we arrive at the 450ms we see displayed immediately after the request ends.
Note that WPT follows a specific protocol:
- If the time corresponds to a duration, it is expressed in milliseconds (ms), e.g. the DNS resolution took 27ms.
- If the time corresponds to a starting point, it is expressed in seconds, e.g. the query started at 0.116s.
Query 7 – A third-party JavaScript script
This request is different from those examined above because the file comes from a third-party domain. The details are as follows:
- Discovered : 0.473 s
- Request Start: 0.702 s
- DNS Lookup: 28 ms
- Initial Connection : 39 ms
- SSL/TLS Negotiation : 153 ms
- Time to First Byte : 48 ms
- Content Download : 9 ms
Note that the browser has to go through the whole connection process again (DNS, connection, TLS negotiation) because the file is on another domain. This adds a considerable amount of time to the request (28 + 39 + 153 = 220 ms).
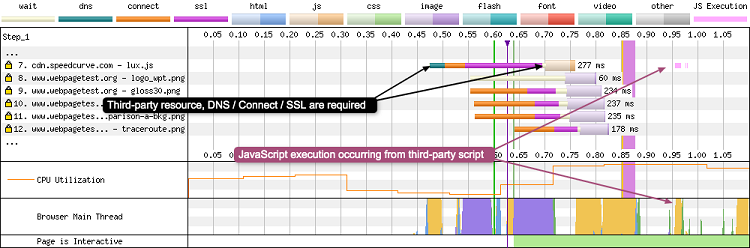
Another interesting point: the script executes in around 200 ms once the download is complete. No information on this execution is provided, but you can see it in the waterfall in the form of pale pink lines after the request, and in orange in the “Browser Main Thread” section(6), which indicates script analysis, evaluation and execution.
Request 15 – A PNG file
In this request, the browser has discovered a PNG file and requests it from the server. Here are the corresponding timings:
- Discovered : 0.652 s
- Request Start : 0.824 s
- Time to First Byte : 214 ms
- Content Download : 28 ms
The delay is calculated as the difference between the time the file is discovered and the time the request is started. The delay is thus the time elapsed between the moment when the browser first finds the resource and the moment when it can send a request to the server to retrieve it.
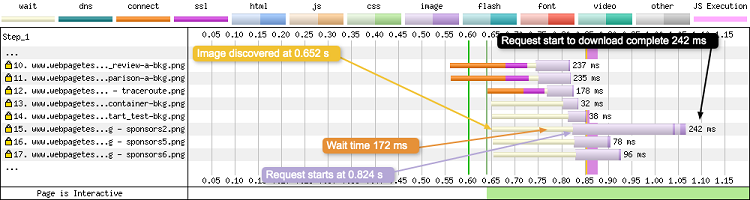
The delay after this request is the time elapsed between the current request and its completion (first byte + content download). As a connection to the domain has already been established ,there ‘s no need to go through DNS resolution, connection and TLS negotiation again.
Request 23 – A moved GIF file
Request 23 may seem trivial, but something’s not quite right. The background of the request is yellow, indicating a server response status code (status code) that is not the usual 200. In fact, this is a 302 code, meaning that the GIF file requested has generated a redirect. Responses with a 3xx status code all have a yellow background. The request details show the following information:
- Error/Status Code : 302
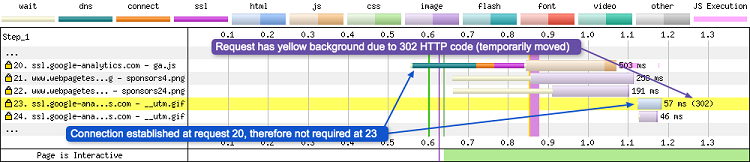
Note that request 23 does not require the establishment of a TCP connection, as this has already been done for this domain in request 20.
Status errorcodes 4xx and 5xx are displayed in the same way, only the background is red, as in the example below (this image comes from a different test):
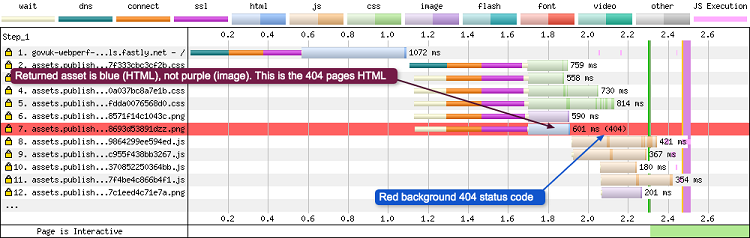
The request details give the following information:
- Error/Status Code: 404
Note here the color of the response corresponding to this resource: rather than being purple (the expected color for an image), it’s blue. This means it’s HTML content, in other words, it’s the server that’s responding with a 404 page because the resource can’t be found.
Downloadchunks
Another detail that may attract your attention: the vertical stripes for each request. As mentioned earlier, the light color means that the request has been made and the browser is waiting for a response. The darker color indicates that bytes are being delivered to the browser for this resource. Sometimes, not everything happens simultaneously, hence the stripes that indicate that the browser is retrieving fragments as it goes along – the red arrows below point to these “download chunks“.
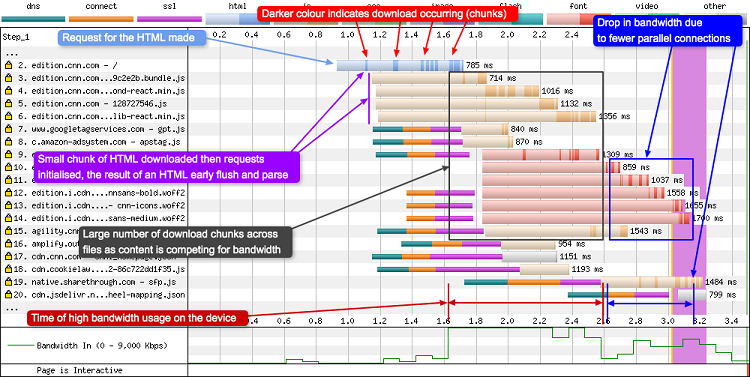
This is particularly noticeable when an HTML early flushtechnique is used (see below – request 2) or if a large number of elements are downloaded in parallel, competing for resources (requests 3 to 9).
Note that the curve showing bandwidth, at the bottom, is at a maximum of 1.6 to 2.5 seconds. You may notice that this fragmentation persists even when bandwidth consumption has decreased (over 2.6 seconds).
So what’s going on here? Well, the number of parallel connections has decreased, so that parallel downloading is less important. However, the connections created in requests 12 to 15 are still in the TCP slow startphase (because this time we’re in HTTP/1.1). As a result, resources are still competing for bandwidth, which is now limited.
Typical scenarios
Here are some of the most common scenarios observed in a WPTwaterfall . I’ll be adding more over time.
DNS-prefetch
DNS Prefetch is part of the Resource Hints Working Draft. It tells the browser that a DNS lookup will soon be required for another domain. In this way, resolution can be initiated without delay. When the domain is actually required, all the browser has to do is complete the TCP negotiation and the optional TLS negotiation. This is similar to the pre-connection example below, in that the element “floats” in the timeline. But here, only the DNS resolution (green) is visible.
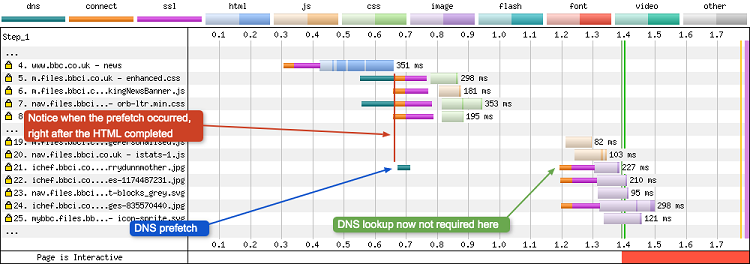
Note when dns-prefetch comes into play in the timeline : almost immediately after the HTML has been downloaded and parsed. It’s easy to see the difference if you compare it to the connection negotiations that take place in requests 5 and 7, where preconnect is used.
Preconnect
Preconnect is part of the Resource Hints Working Draft. It tells the browser that it will soon be necessary to connect to a given domain. By anticipating this connection, requests are sent faster and resources are downloaded more rapidly.
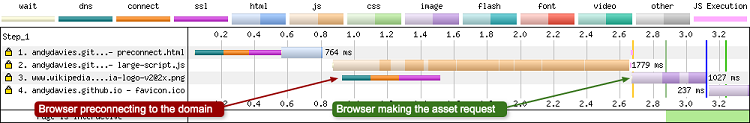
As you can see in the image above, pre-connection appears to “float” in the timeline. This happens long before the actual request for the image is made. The browser uses thishint to connect in advance, before this is necessary. For more information on pre-connection hints, I recommend you read this post by Andy Davies.
Prefetch
Prefetch is part of the Resource Hints Working Draft. It tells the browser to anticipate the retrieval of a resource (for example, a CSS, JS or HTML document) for the current navigation or for a later navigation. For example, if you know that the majority of your visitors will access a specific page from your home page (such as a login page), you can use prefetch to ensure that this specific page already exists in the browser cache. In the example below, I’m anticipating the retrieval of an HTML document that is part of the user’s path:
With Prefetch

Prefetch is visible on request 19 in blue (HTML). This HTML code is simply stored in the browser’s cache and is not analyzed. You can check this in the waterfall by consulting the “Browser main thread”section. During preftech, no activity is visible in the main thread.
Without prefetch
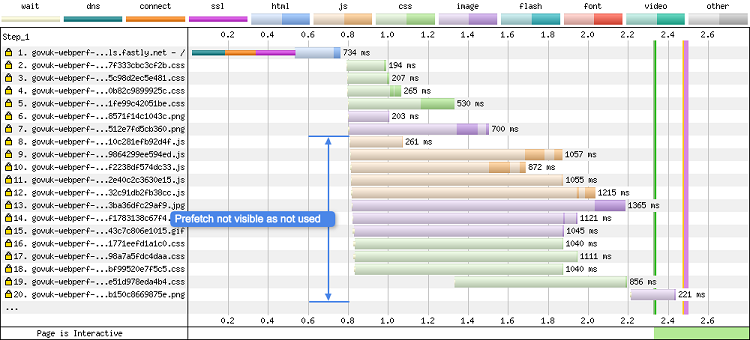
WebPageTest informs us that these are prefetch indicators :
- Priority: IDLE (Details tab)
- Purpose: prefetch (Request tab)
Take into account the prefetchpriority level . In WebPageTest, during Chrome tests, it is listed as IDLE priority . This is the lowest priority in DevTools (in accordance with Chromium ‘s Resource Fetch Prioritization and Scheduling in Chromium document ). So, prefetch is an option, often with low priority, and will be loaded as late as possible by the browser. This is how it differs frompreload, which is mandatory and has a high priority. A resource loaded using preload blocks page rendering, so make good use of it, otherwise you risk degrading your performance.
Prerender
Prerender is part of the Resource Hints Working Draft. It allows you to anticipate the course of future navigations (which implies monitoring with analysis tools). In December 2017, with the release of Chrome 63, Google overhauled how prerender works . Here’s a brief before-and-after explanation:
- Before Chrome 63 : Chrome would look for the <link rel = “prerender”> element and create a masked page for the URL indicated by it. Invisible to the surfer, this page was downloaded, including all dependent resources, and all JavaScript code executed. If the user accessed the page, the “pre-generated” page was replaced in the current tab, giving the impression of instant loading. But this method had a few drawbacks. Firstly, memory usage was high to maintain the hidden page, which was unsuitable for low-end devices. Secondly, given that interactions were not supposed to occur with a pre-generated page (as the user doesn’t see it), the task became too complex, whereas the ultimate goal was to actually generate the page. This prerender implementation was therefore abandoned.
- Since Chrome 63 : Since the release of Chrome 63, the prerender flag is still recognized and tracked by Chrome, but its handling has changed. Chrome now uses a technique called “NoState Prefetch” when it detects a <link rel = “prerender”>element . It is then tracked only if these two conditions are met: the surfer is not using a low-end device and is not on a mobile connection. In this case, the page is downloaded and analyzed to identify the resources to be downloaded. These are then downloaded and cached with the lowest possible priority (IDLE ). No JavaScript is executed on the pre-generated page, and if the user accesses it, the browser must load the cached resources in a new tab (not as before). You can find out more about “NoState Prefetch“ here .
So, what does this prerenderlook like in a WebPageTest waterfall ?
With Prerender
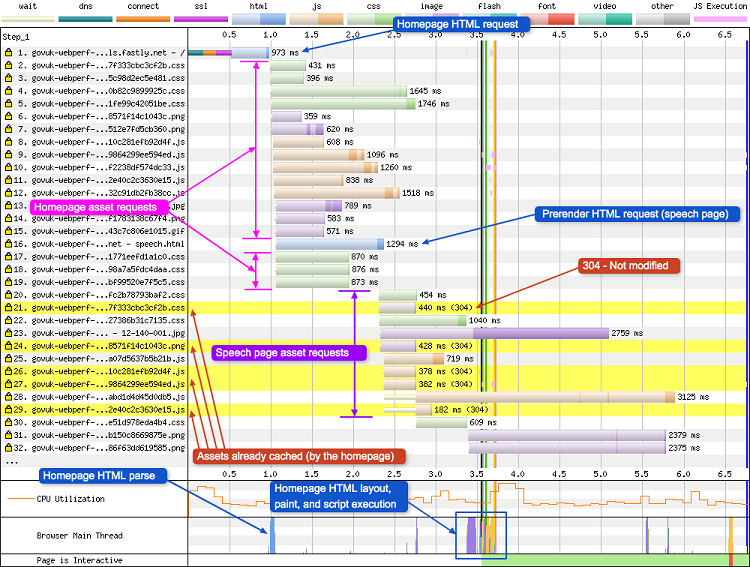
In this waterfall, you can see the “normal” page and the resources handling requests 1 to 19. The prerender is at request 16. Here you can see a request for a second HTML page. Once completed, requests 20 to 29 are triggered. See the number of requests with a yellow background and a status code 304: this is a sign that these resources already exist in the browser cache, since the HTML home page (request 1) put them there some 100ms earlier. Note that very little happens in the browser’s main thread (apart from the analysis of the home page, which occurs because request 30 (CSS) has finished – and the JS of request 28 is not blocking). This confirms that all resources are stored in the browser’s cache for future use.
As with prefetch, WPT provides some information on pre-generated resources to detect that requests are not coming from a standard web surfer’s browsing system:
- Priority: IDLE (Details tab)
- Purpose: prefetch (Request tab)
NB: The fact that they originate from a prerender hint is not explicit, we only see “prefetch“, as “NoState Prefetch” is used.
Without Prerender
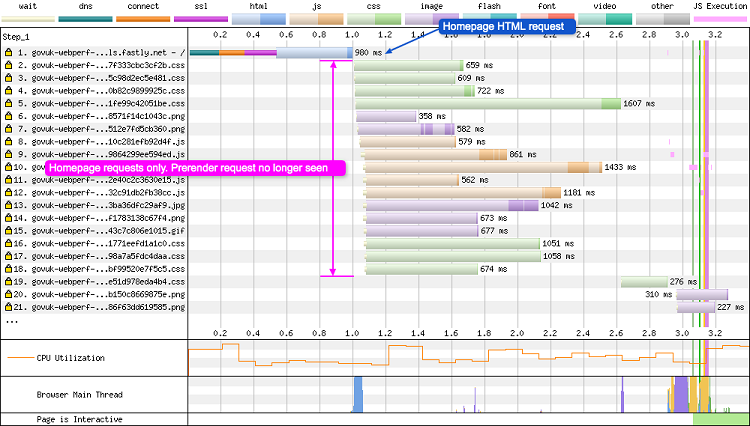
Without prerender, the waterfall is “standard”: only requests for sub-resources of the current page are visible.
Preload
Preloadingis a W3C recommendation. It is used to prioritize the loading of selected resources. The browser can therefore be warned that a resource will be absolutely necessary soon and should be loaded as quickly as possible.
This technique is often used when loading Web fonts . Without preload, when loading a font, the browser must first download the HTML code and CSS, then parse them to create the rendering tree. Only then can the browser request the font. This can lead to what’s known as a Flash of Invisible Text (FOIT) or Flash of Unstyled Text (FOUT). One solution to this problem is to request the Web font file immediately using the preload.
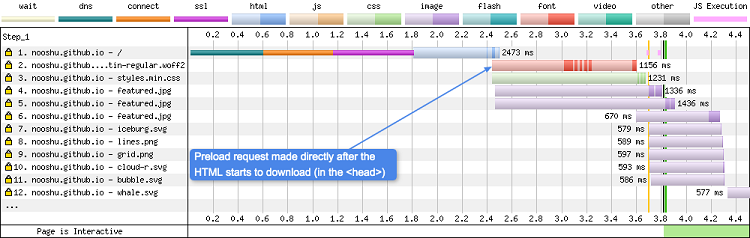
With Preload
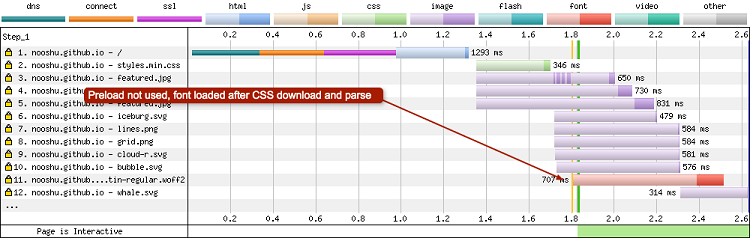
Without Preload
If you compare the two images above, you’ll see that the request for the preloaded WOFF2 format font comes as soon as the HTML code starts to download at request 2 (dark blue band). The browser analyzed the<head>tag, saw the need to pre-load, and immediately requested the file.
In the second image, the browser downloads the font after the HTML and CSS files have been downloaded and analyzed. It is only at this point that the request for the WOFF2 format font can be made. So, when preload is not used, the font is in request 11. I’ve written more about font preloading here.
HTTP/1.1 vs HTTP/2
HTTP/2 is an iteration of the HTTP protocol following HTTP/1.1. Since HTTP/2 uses a single TCP connection and multiplexes files over this single connection, the difference between the two waterfalls is easy to see:
HTTP/1.1
HTTP/2
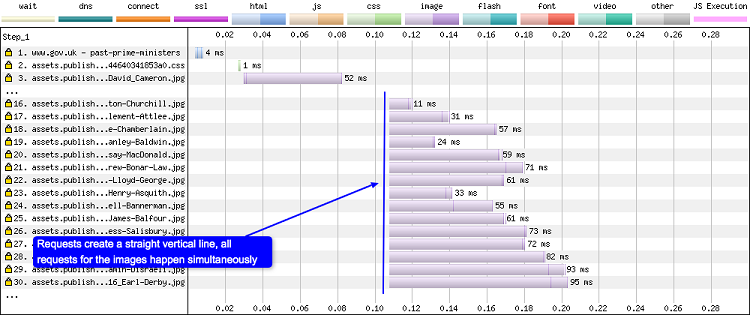
A browser using HTTP/1.1 requests images via separate TCP connections, with these requests being spread out over time (hence the progressive appearance of the waterfall).
A browser using HTTP/2, on the other hand, requests all images at once. The server decides when the images are sent to the browser and in what order.
OCSP
Online Certificate Status Protocol (OCSP) is an Internet protocol used to obtain the revocation status of TLS certificates. One way for a browser to validate a certificate is to connect to an OCSP server for verification. In this case, WebPageTest displays a waterfall that looks like this:
With OCSP
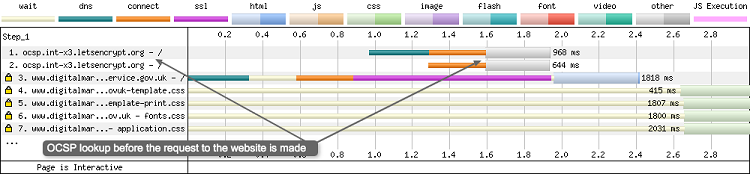
This OCSP verification has a negative impact on loading time. This is because verification requires DNS resolution and an initial connection to the OCSP server. Once the certificate has been verified, TLS negotiation can take place on the original domain. As you can see, the entire waterfall is delayed. It takes almost 2 seconds before the HTML page can be requested!
Without OCSP
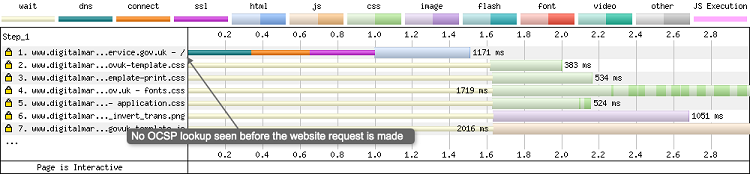
If you compare a waterfall with and without OCSP, you’ll see that TLS negotiation is much shorter without OCSP (300 ms instead of over 1000 ms) and that, as a result, the HTML file request arrives much sooner (at 1 second versus 1.95 seconds). OCSP verification adds 950 ms to the initial HTML request over a fast 3G connection. This is enormous!
If you notice this on your WebPageTesttimeline , you should consider enablingOCSP stapling on your server.
NB: If you’re usingExtendedValidation certificates (EV),OCSP stapling doesn’t completely solve the problem. For more details, check out this technicalthread on Twitter.
NdT: Please note that not all browsers use the OCSP stapling mechanism, especially Chrome for non-EV certificates, so results may be distorted.
Firefox’s enhanced tracking protection
Firefox has enabled enhanced tracking protection by default from version 69 (June 2019). Agents on WebPageTest were updated around the same time. In rare cases, tracking protection requests could be seen in WPTwaterfalls (requests 1 to 3):
![]()
According to Pat Meenan, these requests should now be excluded by default so that they are never visible.
Pre-hiding resources with Service Workers
The use of Service Workers is gradually expanding , and one of the many features they offer is precise control over which resources are cached and for how long. They can also be used to pre-cache files for later use (for offline functionality, for example). An important detail to bear in mind when caching resources via a Service Worker is that the browser may need to download the same files twice: once for the HTTP cache (standard browser cache), and once for the Service Worker cache (Cache API). These are two completely separate caches that do not share resources. These duplicate requests can be seen in a WebPageTestwaterfall :
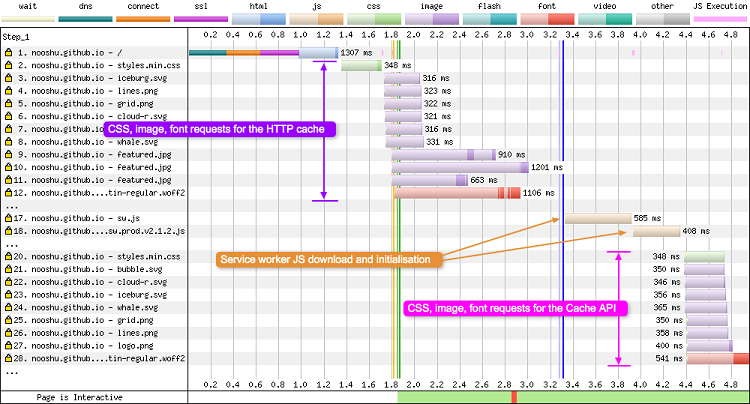
For requests 17 and 18, you can see that the JavaScript Service Worker is requested, downloaded and initialized.
Immediately afterwards, the Service Worker examines its pre-cached JSON file and requests all the resources listed.
NB: In the above example, the Workboxlibrary is used to simplify the setup and use of the Service Worker.
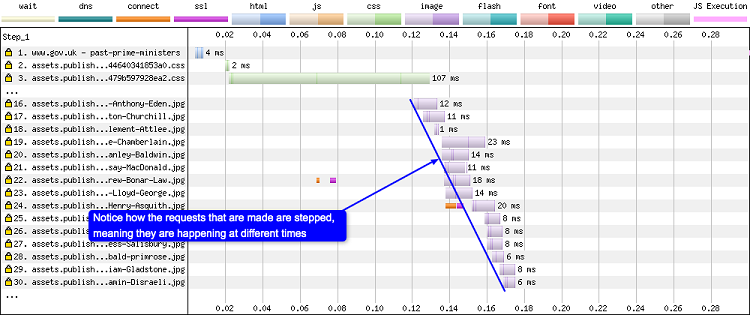
Chrome’sstair-steps
Chrome has developed a stair-stepping technique that takes its name from the shape it gives to the waterfall. Chrome examines resources in the<head> tag(even before the page has a<body>), then requests, downloads and analyzes these requests first. The browser even delays requests for resources in the body until<head>requests are finalized. These steps are best seen in an HTTP/1.1waterfall , as in the example below (although it also happens with HTTP/2):
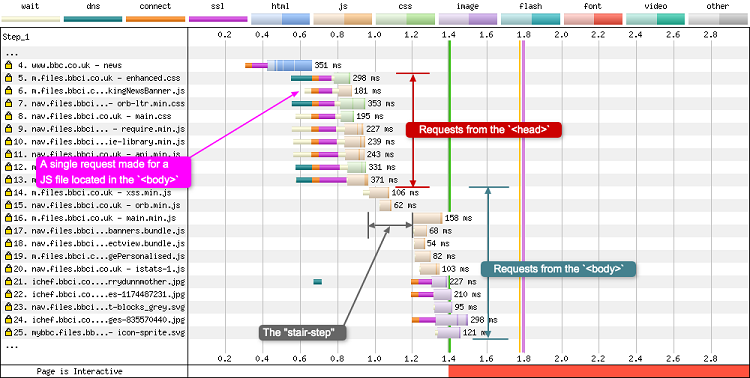
In the image above from the BBC News site, 8 of the first 9 requests are for resources in the<head>, with only 1 request for a JavaScript file located in the<body>. The “step” isn’t very long in terms of duration, only around 200 ms. However, the browser has enough time to concentrate all its CPU and bandwidth on downloading and parsing these resources. As a result,<head> is then configured and ready to run before the<body> resources are downloaded and parsed. Little has been written about this “layout-blocking” phase in Chrome, but details can be found in Pat Meenan’s Resource Fetch Prioritization and Scheduling in Chromium document , as well as in Chrome’s resource scheduler source code.
HTML early flush
HTML early flush was mentioned above in the section ondownload chunks.
This is when a web server sends a small part of the HTML document before the entire HTML response is ready. This then allows the browser to analyze the HTML code it has received and search for resources it can then request in advance (as opposed to waiting for the whole HTML document to download, analyzing it and then requesting the resources discovered).
With early flush
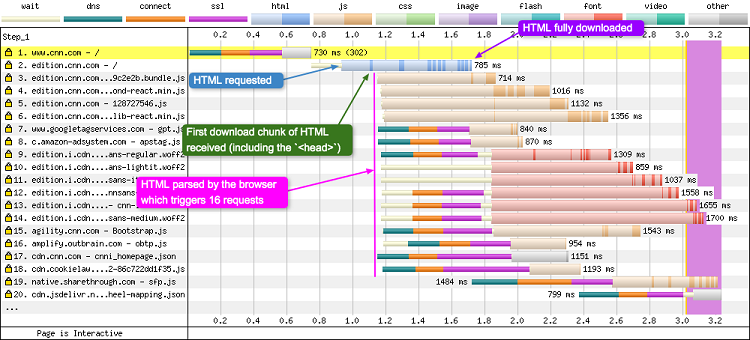
In the example above, the HTML fragment downloaded by the browser (request 2) contains the<head>tag, which refers to JavaScript, fonts, JSON, preload and dns-prefetch instructions . This HTML code is parsed and 16 requests are then almost immediately triggered, all very similar to each other.
NB: note that I haven’t listed any CSS requests. CNN.com has inserted the CSS code in a<style>tag(so no CSS file requests are made). They then trigger CSS requests via JavaScript later in the waterfall, once the JavaScript code is loaded and parsed.
Without early flush
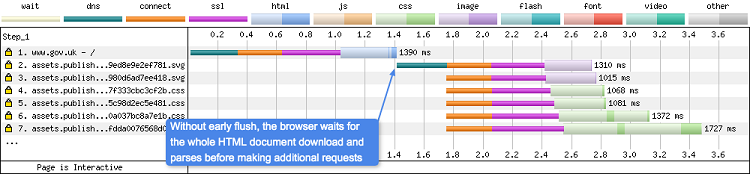
If you compare a waterfall with and without early flush (here for different sites, unfortunately): with, you’ll notice that resource requests are made during the HTML download; whereas without, the browser has to wait for the HTML document to respond in full.
Only then can the HTML be parsed and requests made for other resources on the page. Flush allows the browser to make requests earlier in the waterfall, thus reducing page loading time and increasing perceived speed (if implemented correctly).
Hidden treasures
WebPageTest offers a few features you may not have noticed. Here are a few examples I’ve found useful.
The link between filmstrip and waterfall
This may seem obvious, but it’s worth pointing out. The filmstrip and the waterfall below it are directly linked:
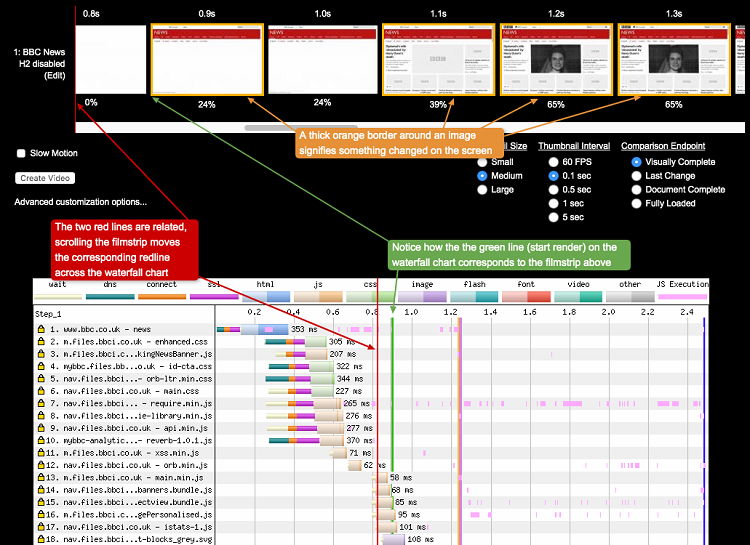
To the far left of the filmstrip, you’ll see a 1 px vertical red line. When you scroll the filmstrip horizontally, you see the same red line moving across the waterfall. Together, they show you exactly what the page looks like at that particular point in the waterfall (you wouldn’t believe how long it took me to notice this feature!).
Another visual cue is this orange border around certain images. It means that something has changed from the previous screen. This is very useful if you’re trying to identify minor changes between screenshots (such as the loading of an icon).
You can see both features in action in the screenshot. An orange border around the image at 0.9 s indicates a major change in the page compared with the image at 0.8 s. Looking more closely at the waterfall, we can see the red line approaching, and the vertical green line (start of rendering). The image at 0.9 s is in fact the start of the page rendering (Start Render).
How to generate a customized waterfallview
Almost all the images you see in this article make use of this feature, which is hidden at the bottom of each graph. WebPageTest lets you customize the elements of a waterfall:
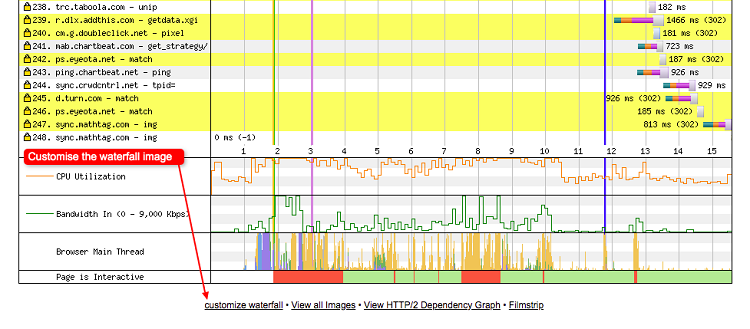
Clicking on it takes you to the customization options you see below:
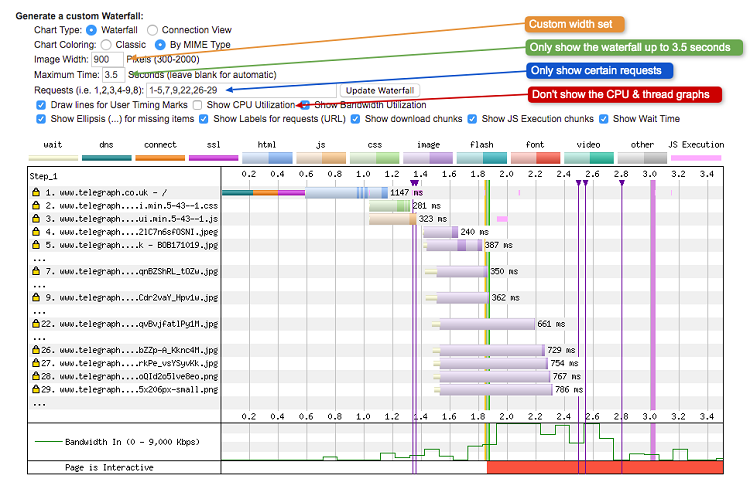
As you can see, I’ve customized these elements:
- Image width
- Period of time covered by the waterfall (note that this cuts out queries that arrive later in the waterfall)
- Selection of queries to show, individually or in sets (ellipses represent hidden items)
- Show CPU Utilization‘ checkboxunchecked to hide ‘CPU Utilisation‘ and ‘Browser main thread‘.
All these options allow you to remove much of the noise in the graph, so you can concentrate on the information you want to highlight.
Once you’re happy with the visual, simply right-click and save it to your device.
How to add custom waypoints using the User Timing API
Here’s a useful feature you may not have known about. Using theUser Timing API, you can mark certain stages in the loading of your page. These milestones will be recorded by WebPageTest and displayed in the results. For example, if you want to know when the browser has reached the end of the<head> tag, you can add the following code just before the closing tag:
<head>
<!– head stuff here… →
<script>window.performance.mark(‘mark_head_parsed’);</script>
</head>
The browser will then add a marker that can be read by WebPageTest. The WebPageTestRun will then display results that look like this:

As you can see from the image above, I’ve defined four markers on the page, and one of them is called mark_head_parsed.
You can add as many marks as you like, it really depends on what you’re trying to measure. Now, if you click on the “customize waterfall”link, you’ll see one or more purple triangles and vertical lines. These are the reference points, or marks, that we’ve just defined:
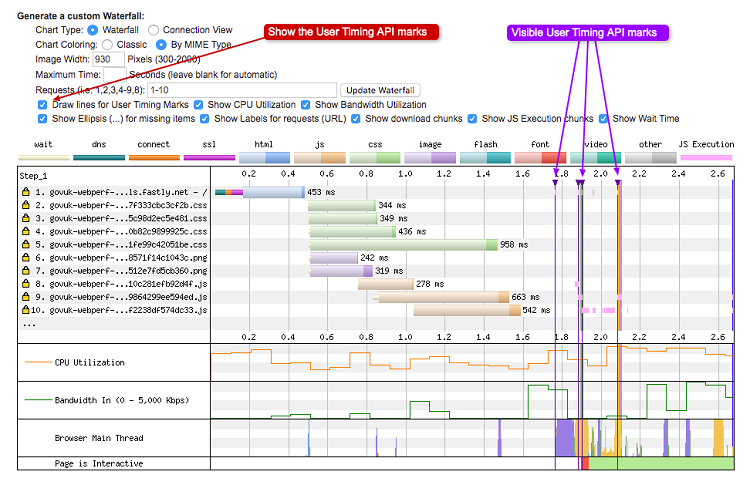
In the image above, the marker points are now visible (you can activate/deactivate them).
But perhaps you’re wondering why you can’t see them on the interactivewaterfall ? The reason is as follows: markers are disabled by default on the interactive graphic. Many third-party JavaScript programs were including marks in their code, polluting the graph with a lot of irrelevant information for most WebPageTest users. It was therefore decided to disable the visibility of marks by default. They are now only visible in the “customize waterfall” link.
NB: If you’re running a private instance of WebPageTest, you can configure it to display activated landmarks on the interactivewaterfallby default.
Conclusion
Here’s a “waterfall” of information on aspects of waterfall that seemed a little obscure to me! As I continue to explore WebPageTest scenarios, I’ll be adding them to my article. It’s a real learning exercise for me too, so if I’ve misinterpreted or missed any points, please let me know.
And if you want to know more about WebPageTest, I highly recommend the book “Using WebPageTest” by Rick Viscomi, Andy Davies, Marcel Duran.
*In this article, we’ve replaced “SSL negotiation” with “TLS negotiation”, as SSL is no longer used.

