


Google offers free tools for testing your website’s speed. One of them is PageSpeed Insights. If you’re here, you’ve probably already tried it, and are disappointed with your score. The search engine is pretty harsh when it comes to evaluating web page performance, and we’re going to see why it considers your loading times to be not good enough, and also, how to read and put this score into perspective.
Understanding how the PageSpeed Insights score is calculated
By simply entering a URL into PageSpeed Insights, Google calculates a performance score between 0 and 100 :
Google PageSpeed Insights resultspage
As a reminder, the search engine considers :
- 0 to 49: a web page is slow,
- from 50 to 89: a web page is moderately fast,
- 90 to 100: a web page is fast.

But how is this score established by Google? Is it possible to reach the holy grail: a score of 100?
To propose this score, Google relies on one of its other tools: Lighthouse. It’s important to remember that the data is collected by simulating browsing under conditions that are far from optimal, and that don’t necessarily represent those of your real users. More precisely, in PageSpeed Insights, the Lighthouse score is calculated by default as if your pages were displayed on a mid-range cell phone in “Slow 4G”.
These conditions are representative of an average for the entire global population, across all geographical zones, including those with the lowest network quality.
However, your audience is certainly much more local, or at any rate concentrated in a few countries where the bulk of your users benefit from network quality superior to Slow 4G.
Ideally, for a score closer to your reality, PageSpeed Insights should detect the location according to the domain name (e.g. .fr) and propose a score calculation based on average browsing conditions in this geographical area instead of the whole world (indeed, few sites have an audience covering 100% of the globe).
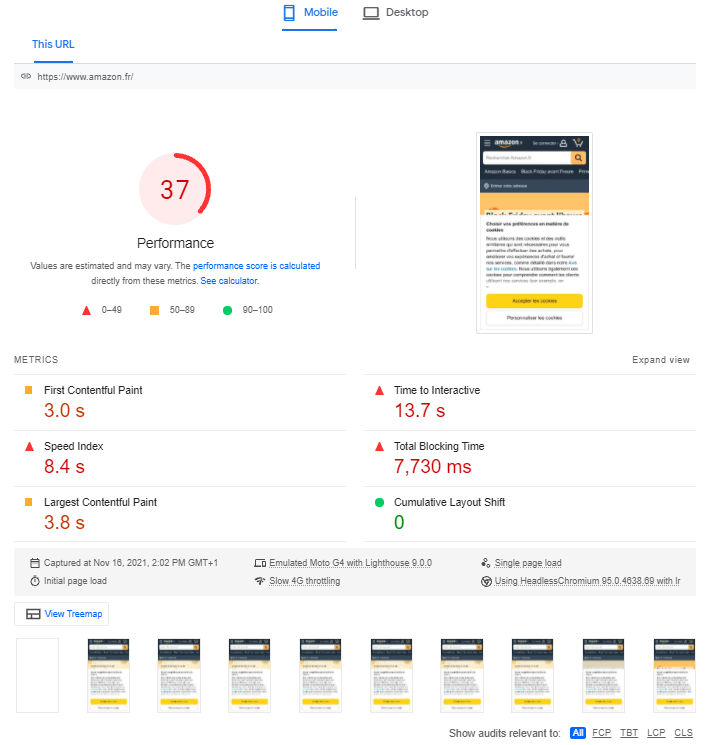
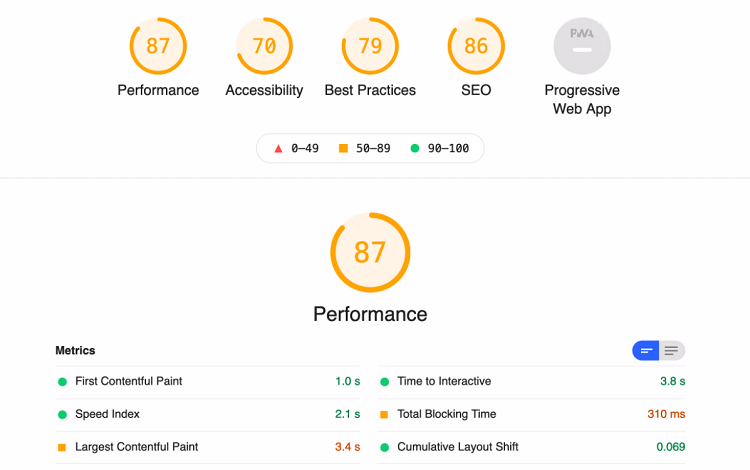
To help you better understand the impact of these browsing conditions on the Lighthouse score, we’ve carried out a test for the same web page (NB: these tests are carried out from the old Lighthouse and PageSpeed Insights interfaces, whose UI has evolved, notably to make it easier to distinguish between the different data offered by these tools) :
- with Lighthouse , simulating a 4G connection in France on a Motorola G4 model (the score is 87):
- and with PageSpeed Insights (under the conditions explained above, with a score of just 19):
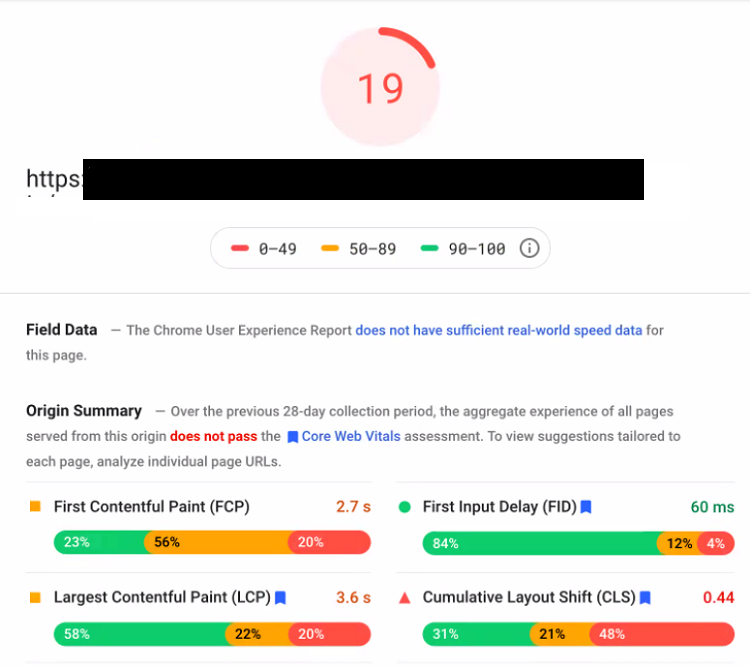
The difference between the results of these two tests is significant, and this example illustrates the impact of the choice of navigation conditions on these performance scores (or rather the impossibility of choosing).
The first thing to remember is that the score indicated by Google is a snapshot at a given moment in time, based on browsing conditions defined by Google, which are not the most advantageous for translating the real speed of your web pages, and which are not necessarily representative of your users’ browsing conditions.
So how do you get Google to deign to consider your web pages as fast?
Let’s go behind the scenes of Google’s PageSpeed score calculation to understand what you can take into account to optimize the speed of your pages, and also how to take a step back.
Behind the scenes of PageSpeed Insights
On its results page, PageSpeed Insights displays the Lighthouse score, established under the conditions described above. To go a step further, you should know that it is calculated on the basis of 6 performance indicators, each with a different weighting in the score calculation (this article will help you understand how each metric is weighted in the calculation):
- First Contentful Paint, which evaluates the moment when the browser renders the very first element in the browser ;
- Speed Index, which evaluates the loading speed of elements above the waterline;
- Largest Contentful Paint, which evaluates the time it takes for the largest visual element to appear in the browser;
- Total Blocking Time, which adds up the blocking times of an interface before it becomes permanently interactive;
- Cumulative Layout Shift, which evaluates the visual stability of the page;
- Time To Interactive, which evaluates the time required for a web page to become permanently interactive without latency.
Thus, on the same results page, different webperf metrics that measure different aspects of speed coexist, divided according to how they are retrieved:
- Field data, gathered from the experience of real Chrome users;
- Lab data, collected on the basis of simulated navigations (as seen above, used to calculate the Lighthouse score).
Field data and Lab data are not retrieved in the same way,
which is why the same indicators do not display the same results depending on the method of collection.
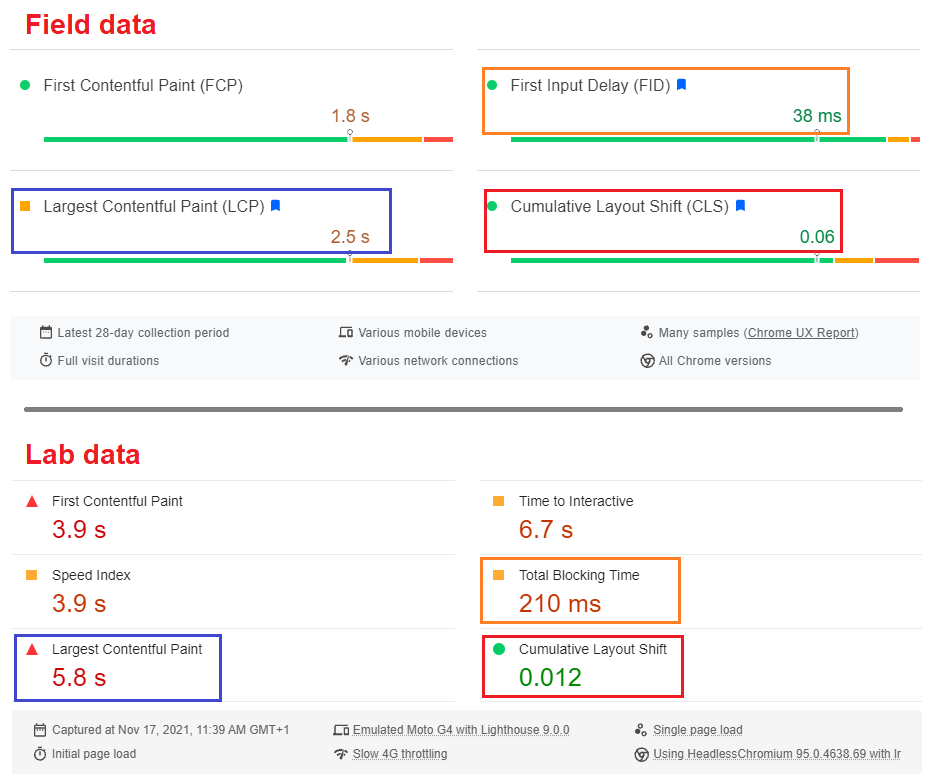
In the test above (this is the new interface deployed by Google in November 2021), Field data shows that, according to Google’s CrUX panel data, 75% of users have an LCP of less than 1.8 seconds; but the LCP measured in Lab (Lighthouse) data is 5.8 seconds. This is yet another illustration of the fact that Lighthouse data (and therefore PageSpeed Insights) doesn’t always correspond to your reality.
To reinforce this point, let’s also note the difference between First Input Delay (real data, or Field) and Total Blocking Time (equivalent to FID in Lab data, to which we’ll return later).
We’ve seen that the Lighthouse score is based on TBT, not FID, and that TBT accounts for 25% of the PageSpeed score. So if your TBT is poor, the impact on your PageSpeed score will be significant.
However, you should know that FID better represents interactivity and the real experience of your users. Why?
Because FID indicates when the browser is able to respond to a user interaction; whereas TBT is an accumulation of periods during which your interface doesn’t respond to interactions. But these periods can accumulate at the beginning or end of the loading of your web pages without interfering with use!
Let’s take a practical look at the impact of taking TBT rather than FID into account on your PageSpeed performance score.
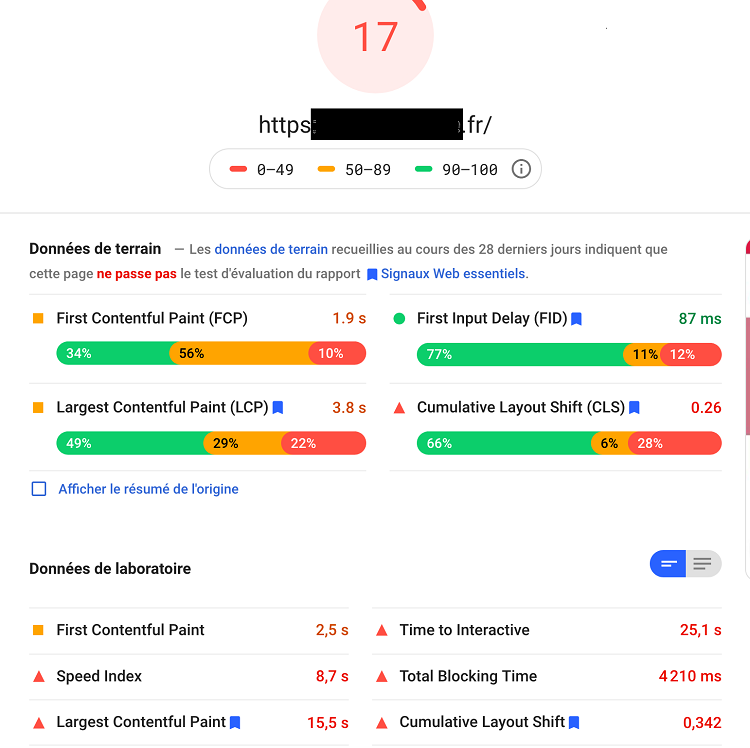
We’ve tested a page with PageSpeed Insights, and it scores 17. The FID is 87 ms, and the TBT is 4210 ms:
Then we took the field data (Lab) and integrated it into the Lighthouse Scoring Calculator (which shows a score without Slow 4G, therefore) to observe the score obtained.
For this test on the Lighthouse Scoring Calculator, we used the FID data (87 ms) instead of the TBT (4210 ms). And we can see that if PageSpeed Insights used FID instead of TBT, the score for this page would be 59 instead of 17!

This is yet another example of how Google rates your site under particularly severe conditions, and how – once again – the score obtained does not necessarily reflect the reality of the majority of your users, whose network quality is probably much better than that simulated by Lighthouse for PageSpeed Insights.
However, beyond the race for the PageSpeed score, everything you can do to optimize each indicator on your site will remain beneficial to the user experience.
What’s more, improving your Core Web Vitals is also good for your SEO, and it just so happens that Core Web Vitals are included in the calculation of the PageSpeed score:
- Largest Contentful Paint,
- Cumulative Layout Shift,
- and the equivalent of First Input Delay, Total Blocking Time (if you improve your TBT, which is Lab data , you also improve your FID, which is Field data ).
The PageSpeed score is thus made up of different speed indicators, each reflecting a different aspect of the user experience.
Some are “easy” to optimize, while others require considerable expertise. If you’re already working on your loading times, you may even have noticed that an optimization can improve one indicator while simultaneously degrading another. To avoid this problem, our engineautomatically applies speed optimization techniques while allowing them to be intelligently articulated in relation to each other.
So, now that you know the recipe for the PageSpeed Insights score, let’s see if all is well in the recommendations that Google offers on its results page.


