









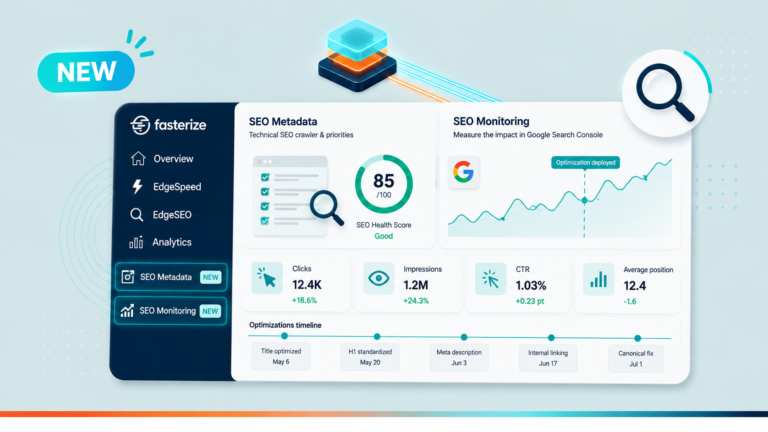
Two new applications are now available in the Fasterize console: the first crawls your site and surfaces your technical priorities, the second places your optimisations back into your Google Search Console data.
You deployed an SEO optimisation on a Tuesday. Three weeks later, impressions are up. Good news? Not so fast. To find out, you need to track down the exact deployment date, the list of URLs affected, export Google Search Console, and cross-reference the lot in a spreadsheet.
“If I’m going to test a recommendation, I need to be able to see its impact.”
We have been hearing this for a long time. You may well have said it yourself.
Until now, Fasterize answered the hardest part of the problem: getting from recommendation to action. You deploy your optimisations directly on your site, within a controlled and reversible framework, without waiting your turn in the IT roadmap.
But action does not stand alone. Before it, you have to decide where to focus your efforts. After it, you have to see what happens.
That is what Fasterize brings you today.
Detect. Optimise. Measure.
Detecting and prioritising your site’s technical issues
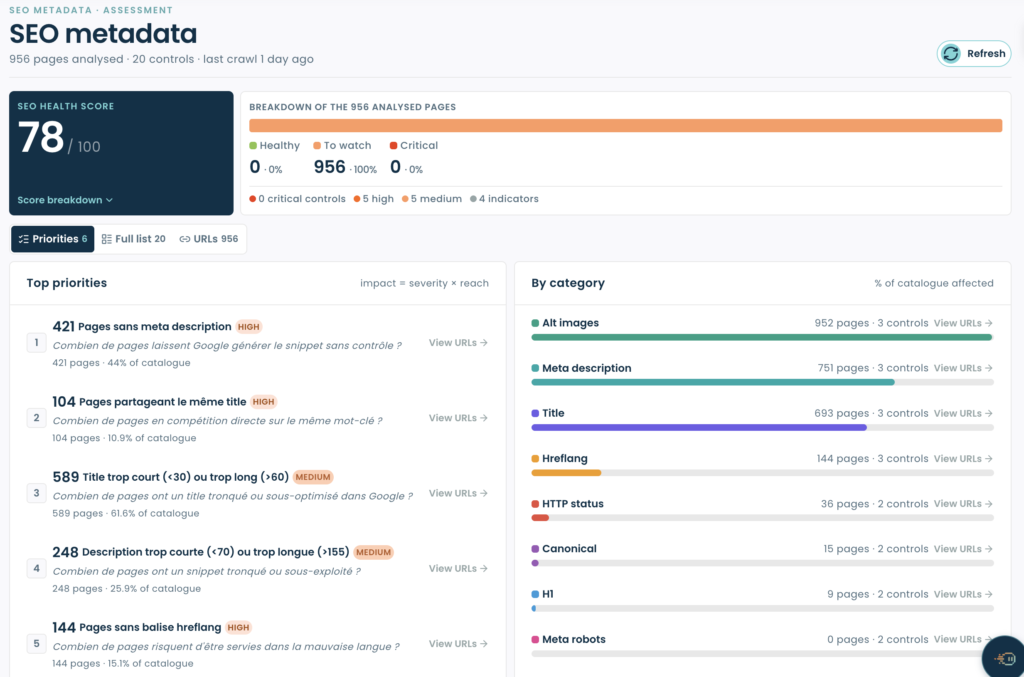
The first of the two applications is called SEO Metadata. The Fasterize crawler goes through your site and checks the essentials of on-page technical SEO: title, meta description, canonical, meta robots, H1, hreflang, HTTP status codes and alt attributes. And what about your JavaScript pages? Rendering switches on automatically as soon as a page requires it. Content that is only delivered once the JS has executed is analysed like any other.
Every issue detected is graded with a fixed severity level, and reports the number of pages affected, their share of the catalogue and the list of URLs concerned.
An SEO health score, to catch regressions before they cost you
All of these checks feed an SEO health score out of 100. Each issue is weighted according to the nature of the check, its severity and the share of the catalogue affected, capped so that a single large-scale issue cannot flatten the score on its own.
A word of caution: this score is not an absolute mark. It does not predict your Google rankings, and it does not mean your SEO “is worth 85”. Its value lies in the movement.
The crawl can be scheduled weekly and run on demand, after a release or a change to the catalogue. From one crawl to the next, a drop in the score signals a regression. A noindex introduced by mistake, duplicate titles, a canonical that disappears… all of them incidents that, without dedicated monitoring, only show up weeks later in the Search Console curves, once traffic has already fallen away. Here, they appear at the next crawl, in the console where you can also fix them.
And because a single figure travels further than an audit, the score also gives you a straightforward indicator to share whenever technical health has to be reported beyond the SEO team.
Put simply, it is less a mark than an ECG, making the movements of your technical SEO visible.
The Priorities view: deciding where to act
On a large catalogue, finding things to fix has never been the problem. Deciding what deserves your attention is.
The Priorities view ranks the issues detected by impact, combining their severity with their reach across the catalogue, so that structural problems surface rather than a flat list of failed checks. Two further views complete the picture: the full list of checks on one side, and on the other the URL-level detail, filterable by HTTP status, page type and issue type.
This ranking is technical. It structures the priority; the business trade-off remains yours. But it changes one essential thing. The list of pages returned by a check becomes the targeting for a fix, deployed from the console, without taking up a development cycle.
Detect, fix, then analyse the result without switching tools. The console becomes the cockpit of your technical SEO.
Your actions, cross-referenced with your Search Console data
Once the fix is live, the question that matters remains: what did it change?
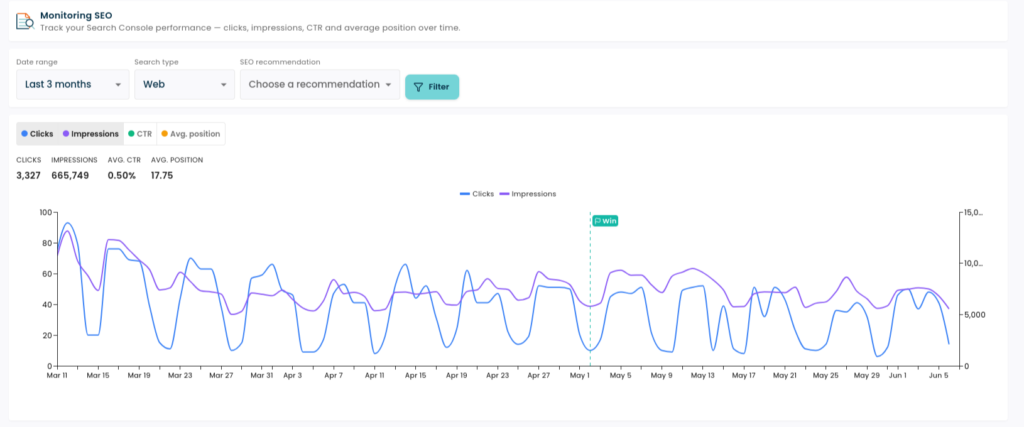
That is the role of the second application, SEO Monitoring. Connect your Google Search Console, and your clicks, impressions, CTR and average position feed straight into your Fasterize console. Your deployed optimisations appear on the curve, each one marked at its deployment date. To isolate the effect of any one of them, a filter narrows the reading to the set of pages it targets.
These markers change how the data reads. Before and after sit on the same screen, with the context you need to tell the difference between the effect of your action, a Google update or seasonality. Two tabs sharpen the analysis. Pages, to identify those performing or slipping within the scope of the optimisation. Queries, to see which searches they appear on, including newly captured queries.
Google Search Console supplies the data. Fasterize puts it back into the context of what was deployed.
Detect. Optimise. Measure.
Until now, these three moments lived apart: the diagnosis in one tool, the action in another, the measurement in a third tab. And you, in between the three, joining the dots.
Now? Your site’s technical health, your priorities, your fixes and their curves are read in one place. What we are launching today is the first scope, and these two building blocks will grow. The direction will not change: one place to see, decide, act and measure.
More is coming !
Both applications are available in your console from today. Already a client? Your CSE will be glad to walk you through them. Not yet? Request a demo, and come and watch the loop run on your own site.