


article img {
margin:15px !important;
}
.grey-box {
background: #dfe1e1;
padding: 20px;
margin-bottom: 20px;
}
On March 19 and 20, SEO Camp’Us was held in Paris. Among the many conferences, Guillaume Giraudet, CEO of 209 Agency and Sacha Morard, CEO of Moarty discussed the importance of website performance for SEO.
Here’s a report, with our comments!
Over the past 3 years, the weight of web pages has increased by 200%, and they have become increasingly complex (the number of scripts has multiplied by 4!). An increase which, according to several studies, has a negative impact on SEO (and business), as Guillaume and Sacha explain.
Indeed, the two speakers present two studies highlighting the correlation between loading time, number of crawls and number of visits per page:
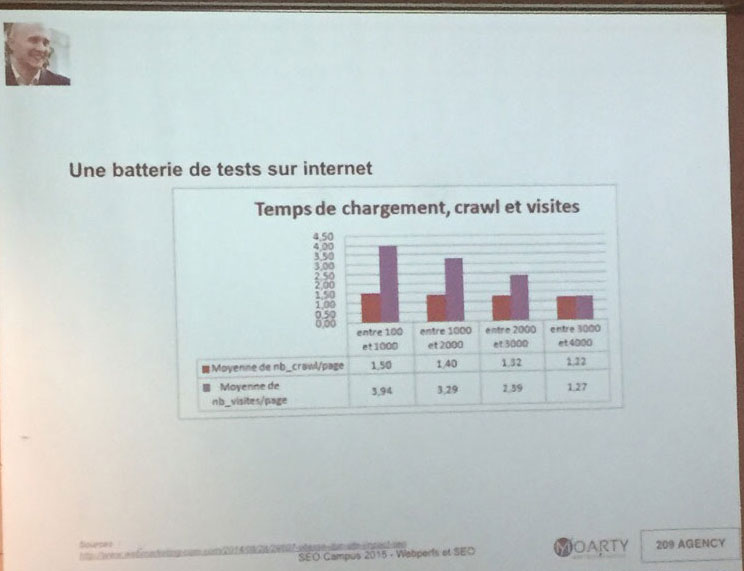
The first graph shows that the number of crawls per page is slightly higher when a site loads faster: on average 1.50 times for a site loading between 100 and 1,000 milliseconds versus 1.22 times for a site loading between 3,000 and 4,000 milliseconds.
What’s even more striking in this first graph is the evolution of the number of visits per page according to loading time: 3.94 for a site loading between 100 and 1000 milliseconds versus 1.27 for a site loading between 3,000 and 4,000 milliseconds.
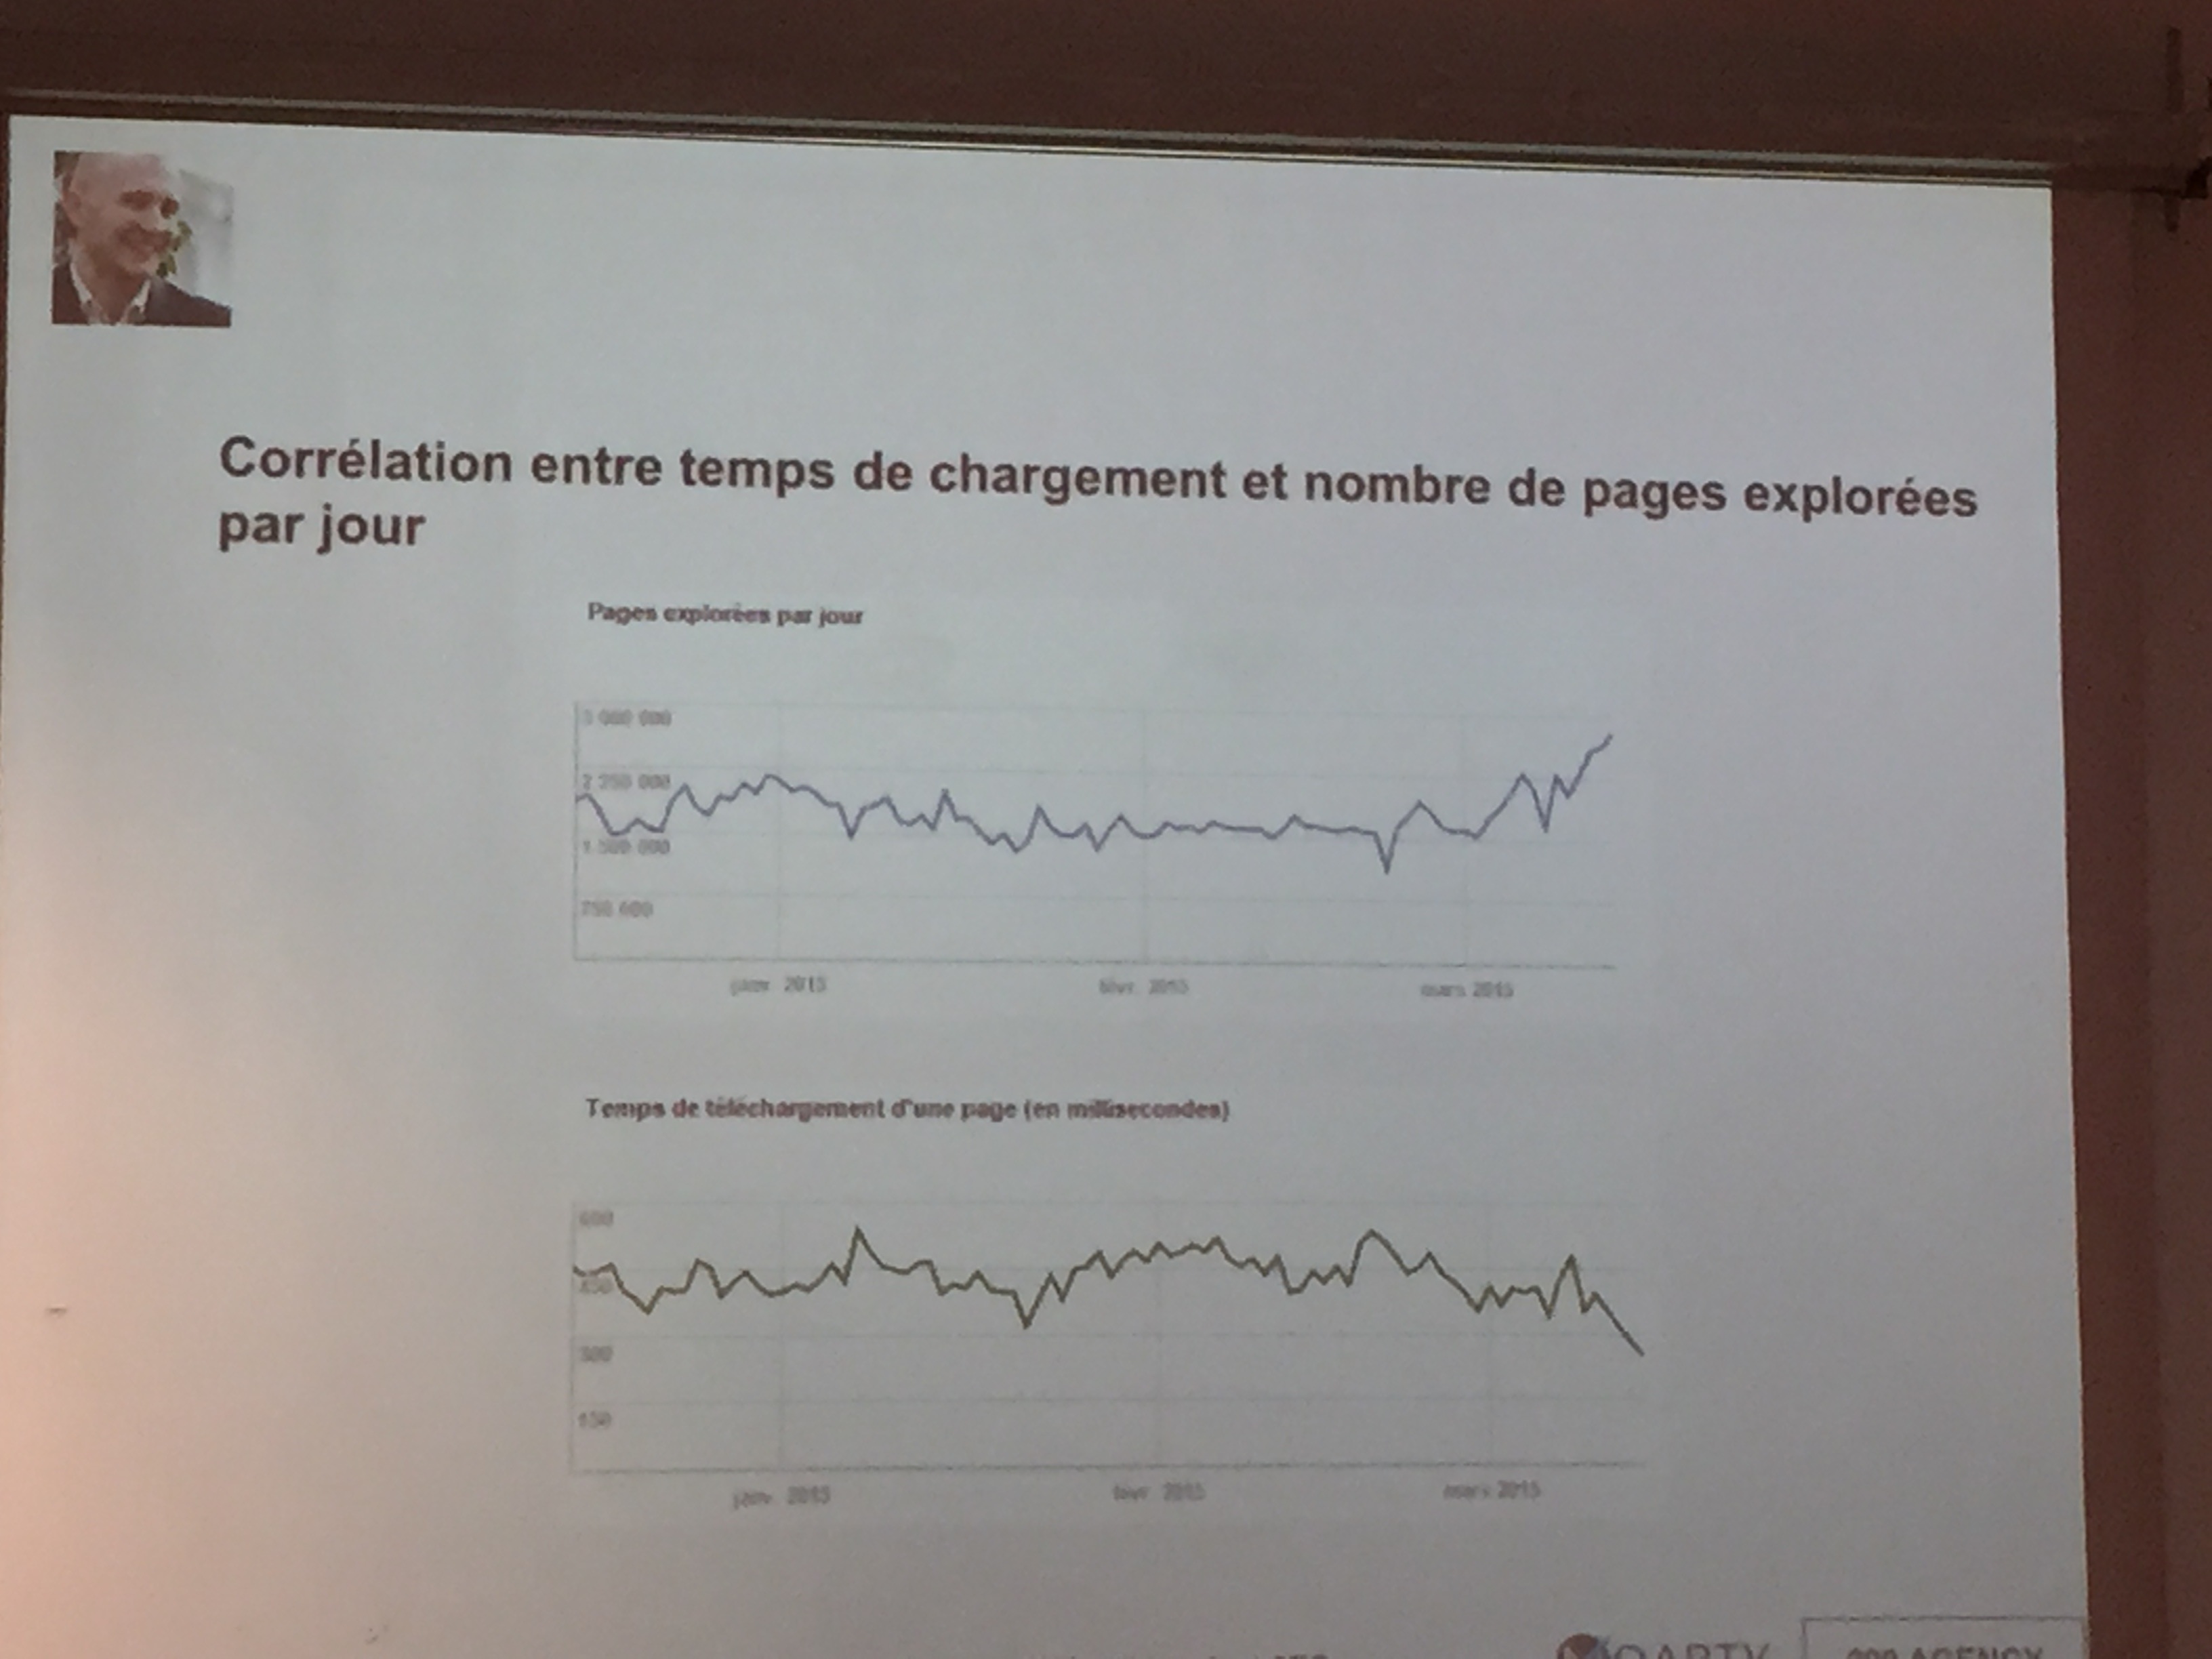
The second study presents two graphs familiar to webmasters:
- the first shows changes in the number of pages crawled between January and March 2015;
- the second shows the evolution of loading times between January and March 2015.
These two graphs clearly show that the drop in loading time in March is accompanied by an increase in the number of pages crawled.
This type of study clearly demonstrates Sacha and Guillaume’s introduction: loading time impacts SEO.
But what can be done about this increased weight and complexity?
How do you measure your website’s performance?
“Before any diet, a diagnosis is essential! To determine the performance of your website, the two speakers recommend:
We can add to this list WebpageTest, which has become a true benchmark in web performance measurement.
In fact, it’s the only tool that measures the Speed Index of your pages (see below), which is the metric closest to the user experience. To better understand the reports generated by these tools, here are a few explanations of the key metrics:
-
-
- Load time corresponds to the overall loading time of a page on your site. This metric is not representative of the user experience, as the user’s attention is seized as soon as the first elements appear. A web surfer will not wait for the entire page to load before interacting with the site. Loading time is therefore a partial indicator of a web surfer’s perception of site speed.
-
-
-
- The Start Render is the moment when the white page gives way to the first elements of the web page. The Start Render has a direct impact on the speed perceived by the surfer: the faster the Start Render arrives, the greater the surfer’s sensation of speed.
-
-
-
- The Speed Index measures the visual progression of parts of the page above the waterline and calculates an overall score indicating the rate at which the page is displayed on the screen. The lower the number, the faster the page was displayed. The Speed Index is the most reliable measure, as it is based on the visual progression of page loading. It is therefore the metric that best expresses the user experience.
-
-
-
- Visually Complete indicates when all visual elements of the page are displayed. It is to be distinguished from Load Time, which corresponds to the loading of the entire page (beyond purely visual elements).
-
-
- Time To First Byte is the moment when your browser receives the first byte, the moment when it receives the code to be interpreted. TTFB is linked to the performance of your back-end, as it corresponds to the time it takes your server to return the first byte.
Once these analyses have been carried out, you’ll finally know the state of health of your website at any given moment.
But as Sacha said in his introduction, in the space of 3 years, websites have grown enormously in size and performance: a good part of the Internet has been slowed down! That’s why you need to measure your site regularly, to make sure it’s not losing performance. To do this, you can use RUM (Real User Monitoring) tools, such as :
Google Analytics can be used as a first approach, but it suffers from two shortcomings:
- it measures averages and does not allow you to obtain distributions easily
- performance measurements are sampled at 1% by default, and even if you modify this parameter in the tag call, the number of measurements is limited to 10,000.
How to optimize site performance for SEO?
Optimizing a website can be done on two levels: the backend and the frontend.
Sacha points out that database calls are the most time-consuming. We therefore need to apply best practices to reduce and optimize these database calls.
We could even go down to 3 levels: backend, middle-end and frontend.
Here’s an image that clearly illustrates the time consumption of these different levels:
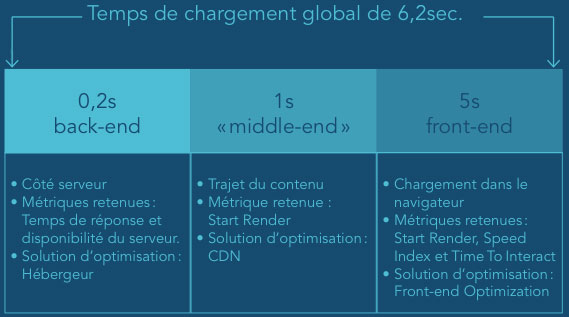
Image taken from our white paper “Stratégies marketing : les dessous de la performance web“.
The impact of the backend on SEO
The backend, and more specifically the Time To First Byte metric, has a direct impact on crawling, as Sacha explains.
In fact, a Moz article published in September 2013 shows the link between server response time and SEO.
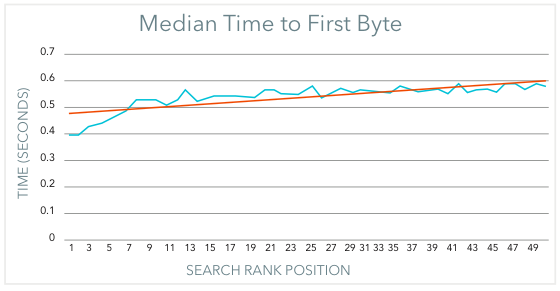
This can be explained by the fact that optimizing this response time makes it easier for Google to crawl web pages. This means that more pages are indexed during the same period of time (the time it takes for the robots to crawl), which mechanically improves SEO.
Extract from our white paper “Stratégies marketing : les dessous de la performance web“.
Among the best practices for reducing the number of calls to the database, two techniques were presented:
- caching: this system allows static resources (such as images or even an entire page) to be stored in memory. This means that the next user to call up the cached page will receive a response directly from the cache, without the request passing through the application server, database, etc…
- CDN (Content Delivery Network): another caching method, but this time distributed across the globe. The CDN automatically duplicates a website’s content on servers located all over the world. In addition to bringing content closer to its users, user requests are not routed back to the origin server. In this way, the server load is distributed among the various CDN servers.
We can provide you with a CDN and implement a series of best practices to optimize your pages on the fly. Your server will be less stressed!
Contact us now!
The impact of the frontend on SEO
As Sacha pointed out during his conference, the frontend is the most time-consuming part of the total loading time. It is therefore the part that can be optimized to the maximum.
But it’s also the most difficult part to optimize, as it requires the implementation of several best practices. These include image optimization (compression, resizing), as well as JS, CSS and HTML optimization (fonts, concatenation, minification).
There are some 30 best practices for reducing the number of database calls and speeding up loading times. We call them “Front-End Optimization”.
They enable :
- reduce the number of requests sent to the server,
- reduce the weight of objects,
- prioritize the display of visible page elements
- optimize SSL.
We apply these best practices automatically to sites connected to our platform.
 Thanks to these best practices, Sacha explains that he was able to reduce the loading time of the home page from 12s to 5.4s and cut its weight from 8.5Mb to 1.5Mb.
Another technique highlighted by the former CTO of Le Parisien is lazyloading, which he considers to be one of the best practices in terms of performance.
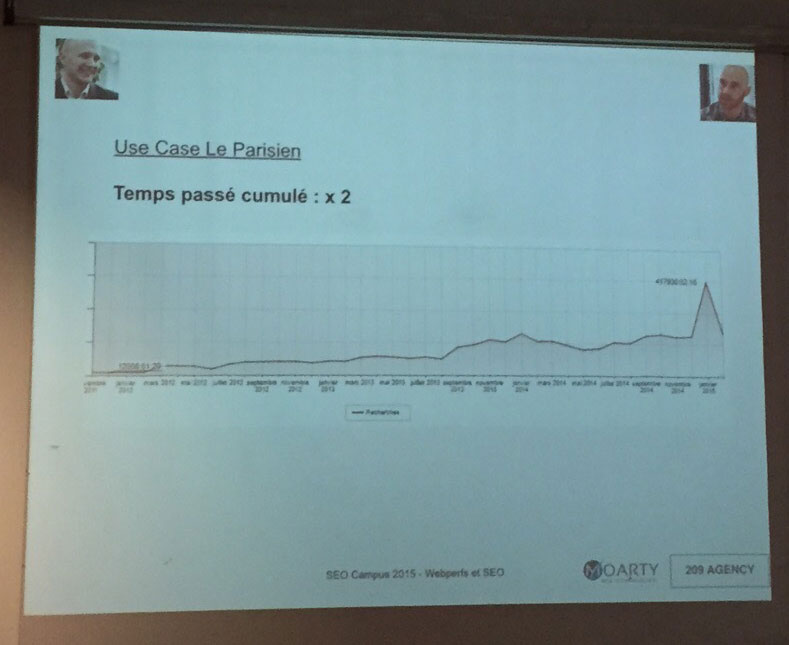
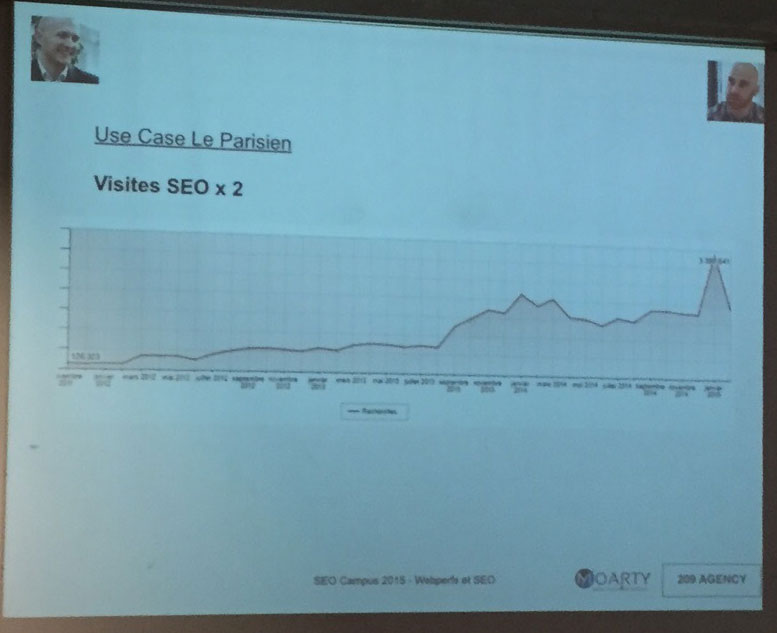
[Use case: Le Parisien] Web performance at the service of SEO
Sacha and Guillaume then presented the impact of these optimizations on the natural referencing of the www.leparisien.fr website .
Their analyses showed that for visitors coming from natural referencing :
- traffic doubled
- bounce rate dropped by 8 points
- average time spent on the site also doubled
For our part, we found that our optimizations resulted in :
- a 13% drop in overall loading time
- a 50% improvement in Speed Index
- a +24% increase in conversion rate
- a 3% increase in the average shopping basket
- for one of our customers, a leader in media sales.
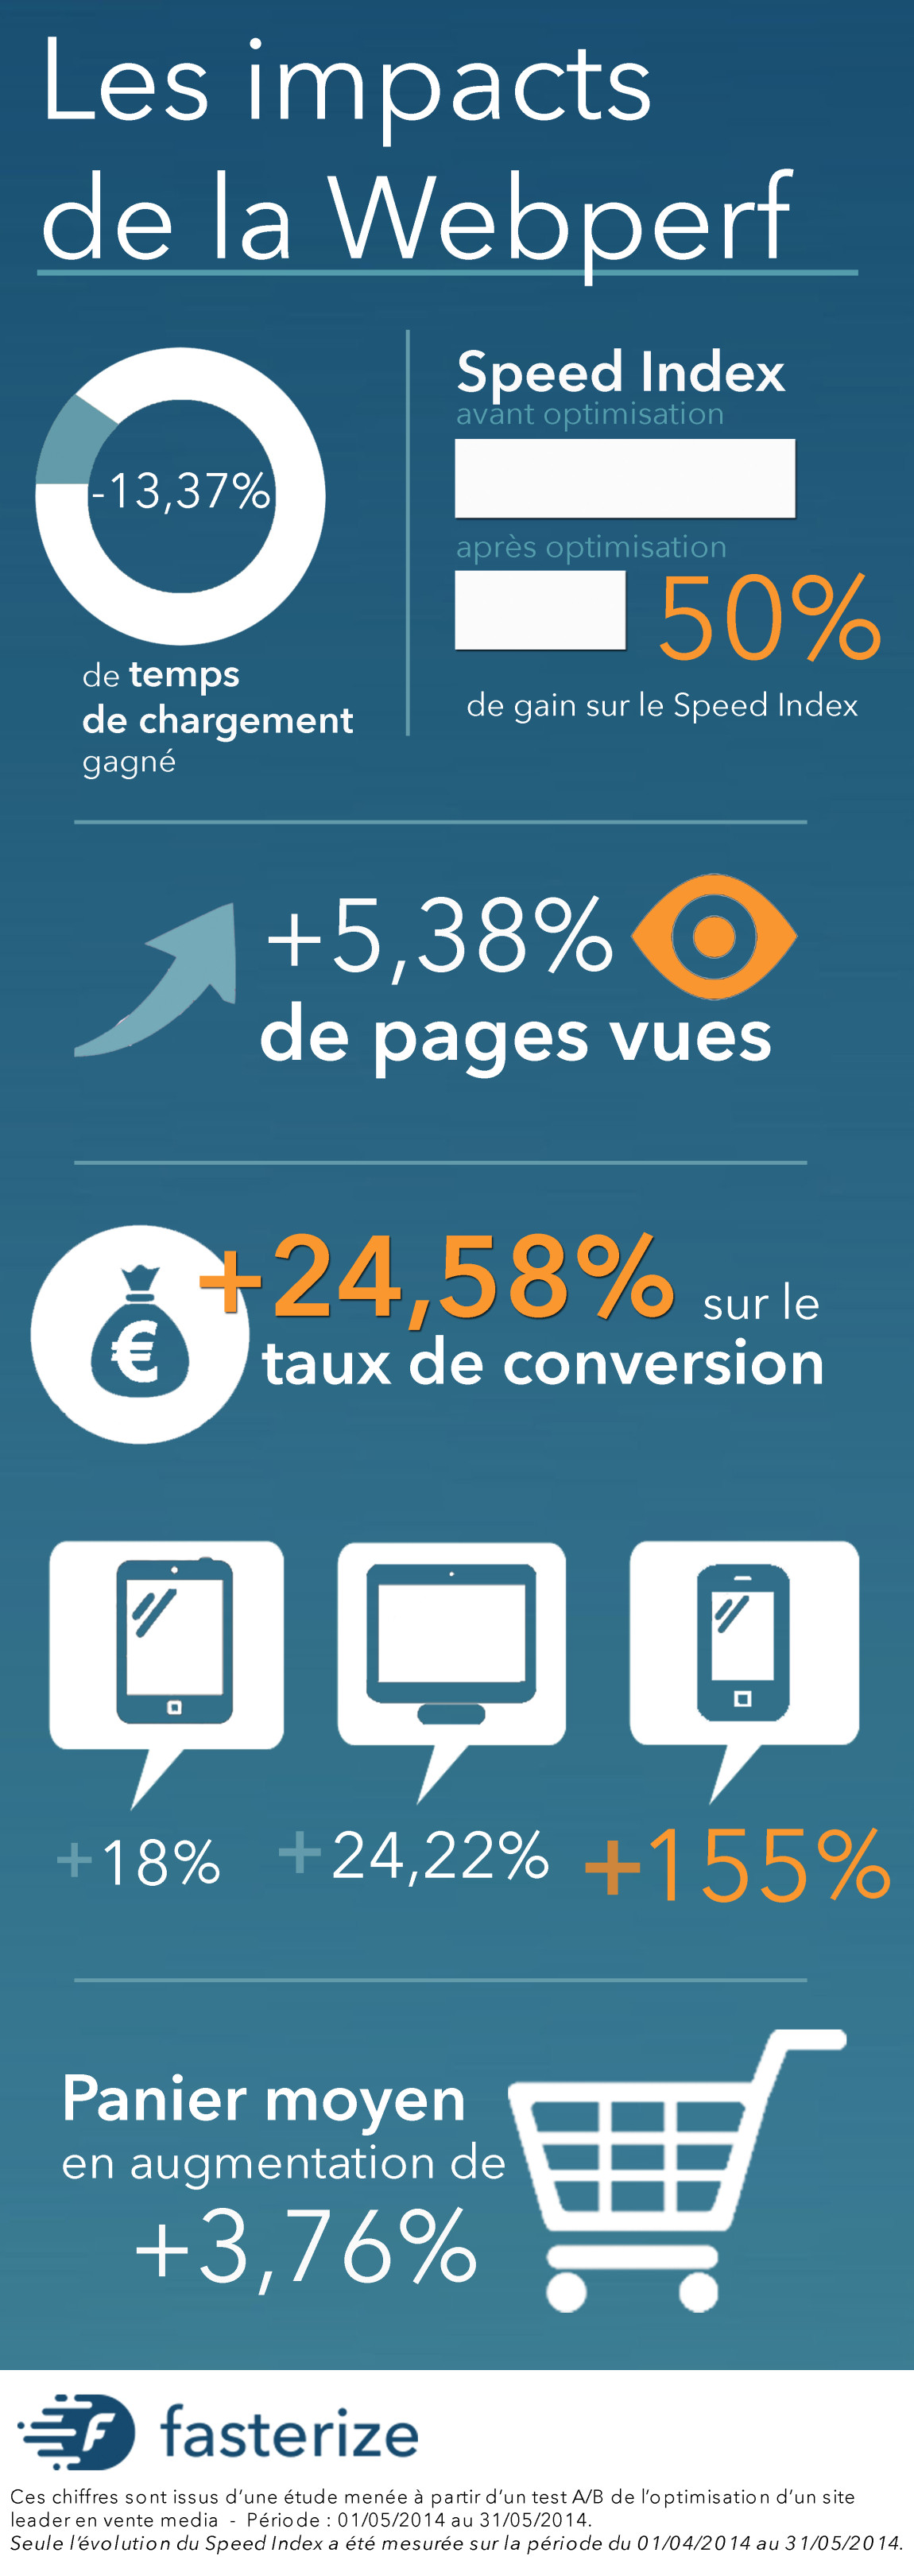
These 2 use cases clearly demonstrate once again that web performance has an impact on both SEO and website business.


