


Today I’d like to show you a graph we’re quite proud of.
We monitor quite a few things on the Fasterize platform, and in particular the time spent in the engine core.
Obviously, this time has to be as short as possible, otherwise the acceleration of loading times takes a hit!
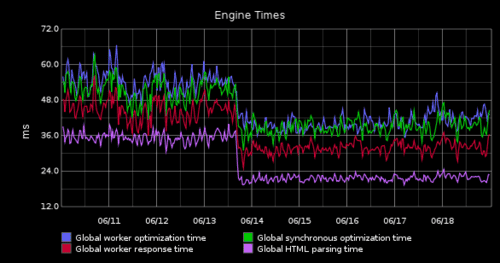
So here’s the graph in question:
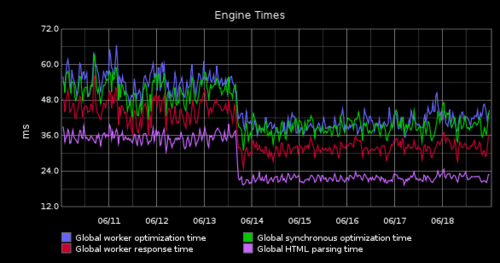
On this graph, we can see that the time spent optimizing HTML pages (Global synchronous optimization time) has dropped from around 50ms to 40ms. It doesn’t sound like much of a 10ms gain, but for us it’s enormous.
At 50ms, we’re doing 20 optimizations/s per process. At 40ms, it’s 25 optimizations/s, an increase of 25%. In concrete terms, this means that with the same platform, we process 25% more requests!
Webperf and figures
The title of this post deliberately refers to the figures that everyone repeats about webperf, and in particular Amazon’s (which is starting to date): “100ms more loading time means 1% less sales”.
In fact, figures can be made to say whatever you like, and they only apply to a given situation. So to see the impact of loading times on your site, you just have to measure it (and that’s what we do at Fasterize to demonstrate our impact). By the way, this blog article(http://larryhaig.wordpress.com/2013/05/14/the-truth-about-performance-related-revenue-statistics/) is pretty much in line with what we think.
Let’s be honest, the majority of our customers have seen an impact (from medium to strong) but there is also one who has seen almost no impact. If we hadn’t implemented A/B testing, we’d never have realized this.
A little technique
For those interested from a technical point of view, one of the code optimizations we carried out was to eliminate the use of the bind method (nodejs).
More info
If you too would like to measure the impact of loading times on your site (number of pages crawled, bounce rate, transfo rate, etc.), please don’t hesitate to contact us.


