


As web performance experts, we are all familiar with the oft-cited examples: Amazon, Walmart, and their gains or losses directly tied to loading speed. Yet these examples, inspiring as they are, raise a fundamental question: what about your business? Your users, your purchase cycles, your challenges are unique.
The real question is not whether web performance can influence business outcomes, that is an established fact. But how, in your specific context, do you prove that impact? How do you measure it, make the case for it, and prioritise the investments needed to maximise your results? And to what extent will your web performance actually affect your conversion rates?
This is where the distinction between correlation and causality comes in. Raw data can reveal trends, but only rigorous testing can prove that a given optimisation translates into a real business gain. Through A/B tests designed specifically for web performance, we have developed a clear and reliable method for connecting technical optimisations to measurable outcomes.
Understanding the difference between correlation and causality
Correlation and causality: two concepts that, whilst closely related, are fundamentally different. A correlation means that two phenomena move together, without one necessarily causing the other. Causality, by contrast, implies a direct relationship: a change in one variable brings about a change in another.
Consider a well-known example: ice cream sales in summer are correlated with a rise in shark attacks. Yet this relationship reflects no direct causality (presumably 🙂). In web performance, the confusion between these two notions can be equally misleading. Users who abandon a slow page do not do so solely because of loading speed. Their behaviour may be influenced by other factors: site usability, the competitive landscape, or the quality of the content itself.
To prove that speed is a driver of conversion, you need to move beyond assumptions. The scientific method applies here: test, measure, and analyse rigorously.
A/B testing: an essential tool for measuring what matters
The key to demonstrating causality lies in A/B tests. These controlled experiments make it possible to compare two versions of a site:
- An optimised version, enhanced for web performance.
- An unchanged version, used as a control.
Via a CDN and an edge worker, these tests can be run with unmatched precision and efficiency. From the moment visitors land on the site, they are randomly assigned to one of the two groups via a cookie. This ensures identical conditions: the same promotions, the same time periods, the same offers.
This process, whilst powerful, requires a rigorous approach. The data collected must be cross-referenced with statistical tools such as the chi-squared test. This tool validates whether the differences observed between groups are attributable to the optimisation or simply to chance. It is this methodological precision that transforms impressions into evidence.
Pitfalls to avoid for reliable A/B tests
Even with a robust methodology, several pitfalls can undermine the reliability of results. One of the most common is session mixing. A user who begins their journey on a smartphone and completes it on a desktop risks being exposed to two different versions of the site, which skews the analysis.
Another issue is insufficient test duration. In sectors with long purchase cycles, such as furniture or travel, drawing conclusions after only a few weeks can obscure the real impact. Finally, external factors such as marketing campaigns or unexpected events can introduce bias. These elements must be carefully filtered or accounted for in the analysis.
Which indicators to track, and when?
Web performance optimisations show up across a range of KPIs, but their impact is observed at different rates.
Technical metrics: indicators such as TTFB or Core Web Vitals (LCP, INP, CLS) respond immediately. They are the first to signal improvements.
User behaviour: average time on site or bounce rate take longer to stabilise, typically a matter of weeks.
Business outcomes: conversions or average basket value require a longer period, between one and two months, before reflecting reliable trends.
Analysing results too early can lead to erroneous conclusions. It is essential to take a broader view, accounting for the time each KPI needs to reflect real impact.
Lessons from our A/B tests
The impact of web performance depends on many parameters, including:
- Target audience age: younger generations, accustomed to fast experiences, are less tolerant of slow loading times.
- Product type: impulse purchases (fashion, gadgets) are more sensitive to speed than necessity purchases (spare parts, healthcare products).
- Average basket value: smaller baskets benefit more from web performance on mobile, whilst larger purchases are more sensitive on desktop, where users take more time to deliberate.
- Competition: the more intense the competitive landscape, the more a fast page becomes an advantage in preventing abandonment.
- Promotions: during periods such as Black Friday, when users act under time pressure, every millisecond counts for conversion.
The amplified impact of web performance during Black Friday
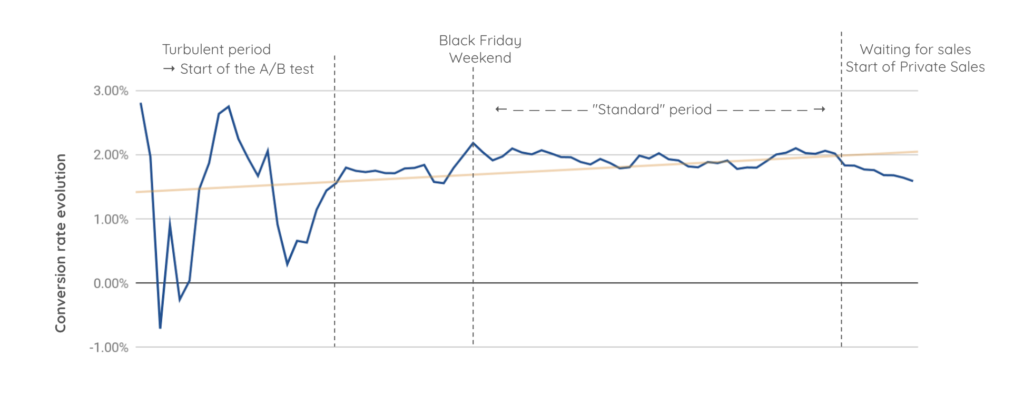
During periods of intense activity, such as the sales or Black Friday, web performance becomes a strategic asset. Every millisecond saved can have a multiplied effect on conversions. These moments, when urgency and competition intensify, demand smooth and fast experiences to meet the impulsive behaviour of users.
An A/B test carried out at the end of the year illustrates this reality clearly. Over the Black Friday weekend, conversion curves show a significant spike amongst users exposed to an optimised version of the site. Under the pressure of limited-time offers, consumers are far less tolerant of extended loading times. In these conditions, display speed becomes a decisive weapon for capturing and converting these high-intent audiences.
Outside peak periods, such as the private sales preceding the main seasonal sales, the impact of web performance remains significant, though its role shifts. During these more considered phases, users are less driven by urgency and adopt a more measured approach to purchasing. Yet a fast and seamless experience continues to influence their decisions positively, reducing basket abandonment and increasing conversions.
These findings underscore that web performance is not solely an asset for peak trading periods: it delivers consistent value throughout the year. Whilst it acts as an accelerator for immediate conversions during critical moments, it also plays an essential role in building a quality user experience over the long term.
The absence of a clear correlation with a specific technical metric
One of the major challenges in web performance is the absence of a direct, universal link between a specific technical metric and business KPIs such as conversion rate. Despite extensive analysis, we have not been able to demonstrate that an isolated improvement in TTFB, FCP, Speed Index, LCP, CLS, or PageSpeed score systematically translates into an increase in conversions.
We have tested multiple hypotheses, combined technical metrics, and studied a range of cases, but the results remain ambiguous.
This does not mean web performance has no impact. Rather, it must be considered holistically. Targeting a single metric in isolation is not sufficient to guarantee a better user experience or meaningful business results. TTFB, for instance, appears to have a notable effect in certain cases, but this is not consistent across the board. This finding highlights the need for holistic optimisation and continuous monitoring of all web performance components, in order to maximise their combined effect on outcomes.
Ultimately, causality does exist, but it is shaped by complex interactions between technical metrics, user behaviour, and the specific characteristics of each site. Longer test periods and larger data volumes are often required to sharpen this understanding and identify the most effective levers.
Our A/B test results in numbers
At Fasterize, we have conducted several hundred A/B tests to measure the impact of web performance optimisations. The results speak for themselves:
90% of our tests show a positive impact on conversion rate, with an average uplift of 10%.
It is worth noting that impact varies by context, web performance remains a universal growth lever.
Conclusion: prove it, communicate it, sustain it
Web performance goes beyond technical considerations: it is a strategic lever that directly influences business outcomes. Through rigorous A/B testing and a solid methodology, it becomes possible to turn optimisations into concrete gains.
But proving impact is only the beginning. The real value of web performance lies in the ability to communicate these results to leadership in order to prioritise investment. A/B tests thus become a shared language, aligning technical efforts with strategic priorities.
Once priorities are aligned, the challenge is to sustain that momentum. In a context where user expectations and technologies evolve rapidly, maintaining continuous attention to performance is essential. What works today may be insufficient tomorrow. The gains achieved must be consolidated and embedded in a process of continuous improvement, because every millisecond matters, not only to meet technical requirements, but to guarantee an optimal user experience.


