


Did you know that you probably already have an automatic analysis tool for your website’s performance? Google Analytics actually offers tracking of the loading speed of your web pages, through the Site Speed function. We will see that even if this function does not allow real-time monitoring for operation like Real User Monitoring (RUM or passive monitoring) tools, it allows global analyses to be carried out.
Drawing on our years of experience, we will detail the settings that we recommend for analyzing the performance of your website, using your Google Analytics.
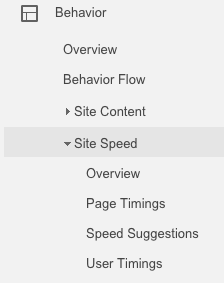
1. Make sure to analyze relevant performance metrics on Google Analytics
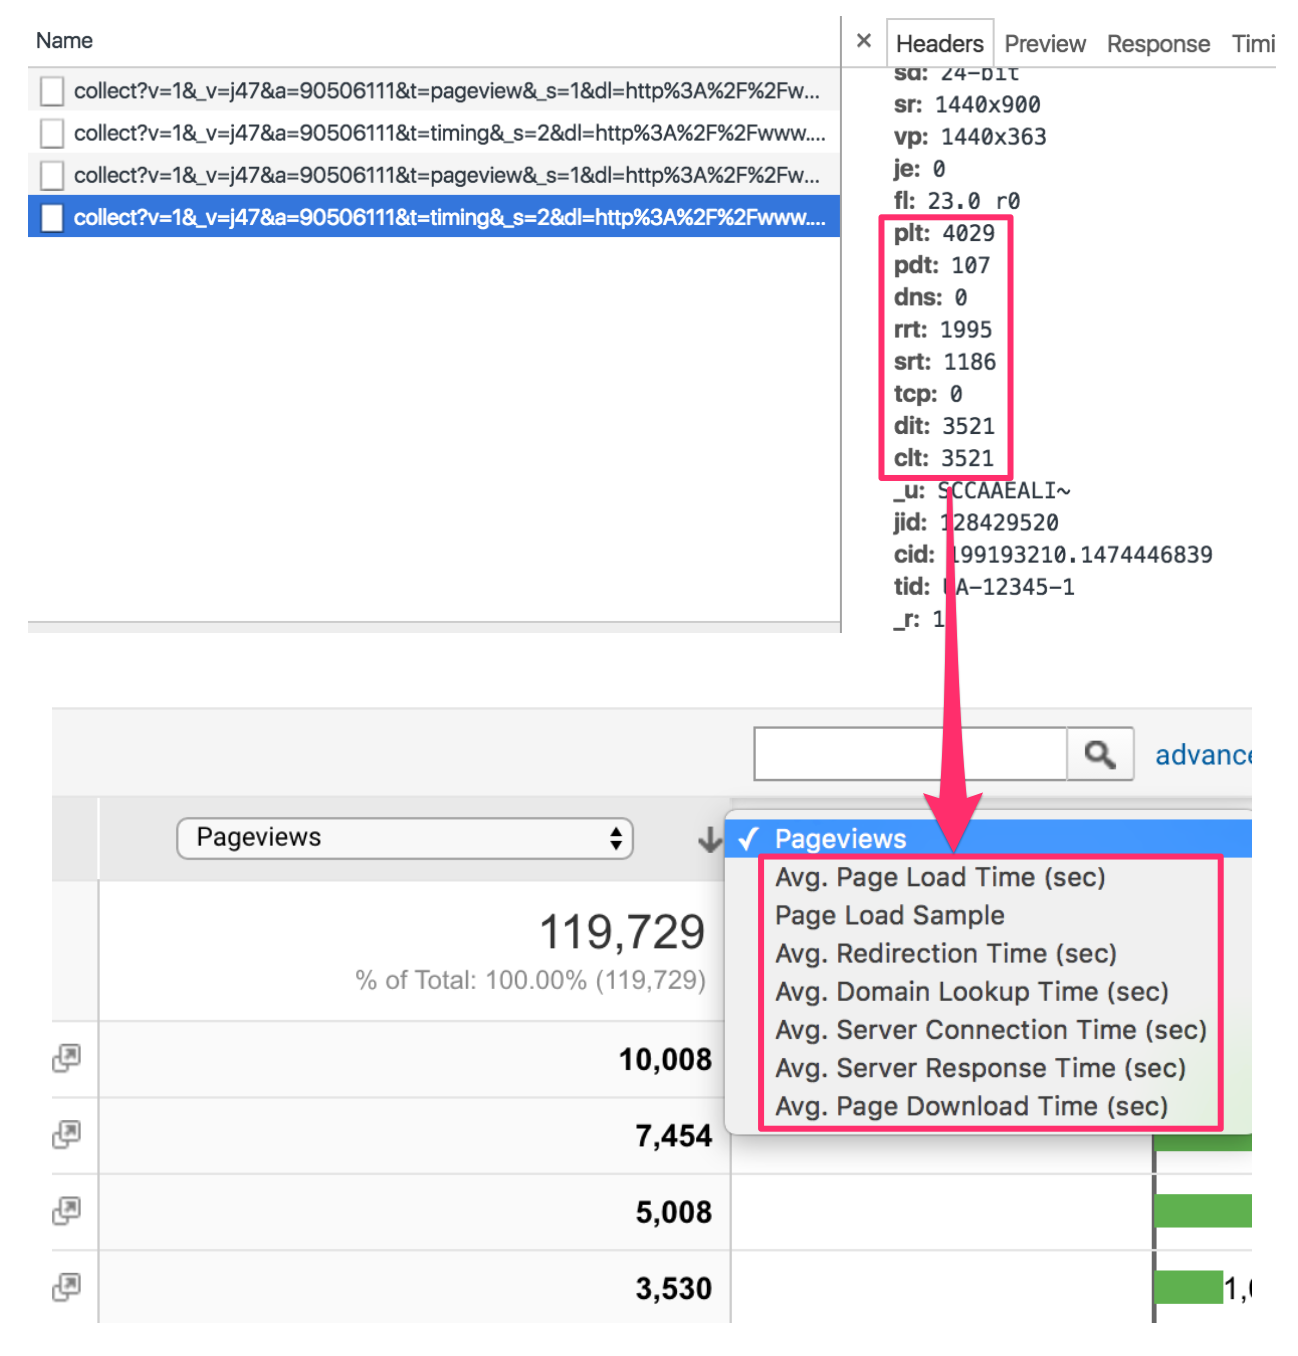
By default, Google Analytics only shows metrics that are available in your browser via Javascript. These are taken from [Navigation Timing].
The metric highlighted is page load time . However, several studies show that this does not have a strong correlation with user experience .
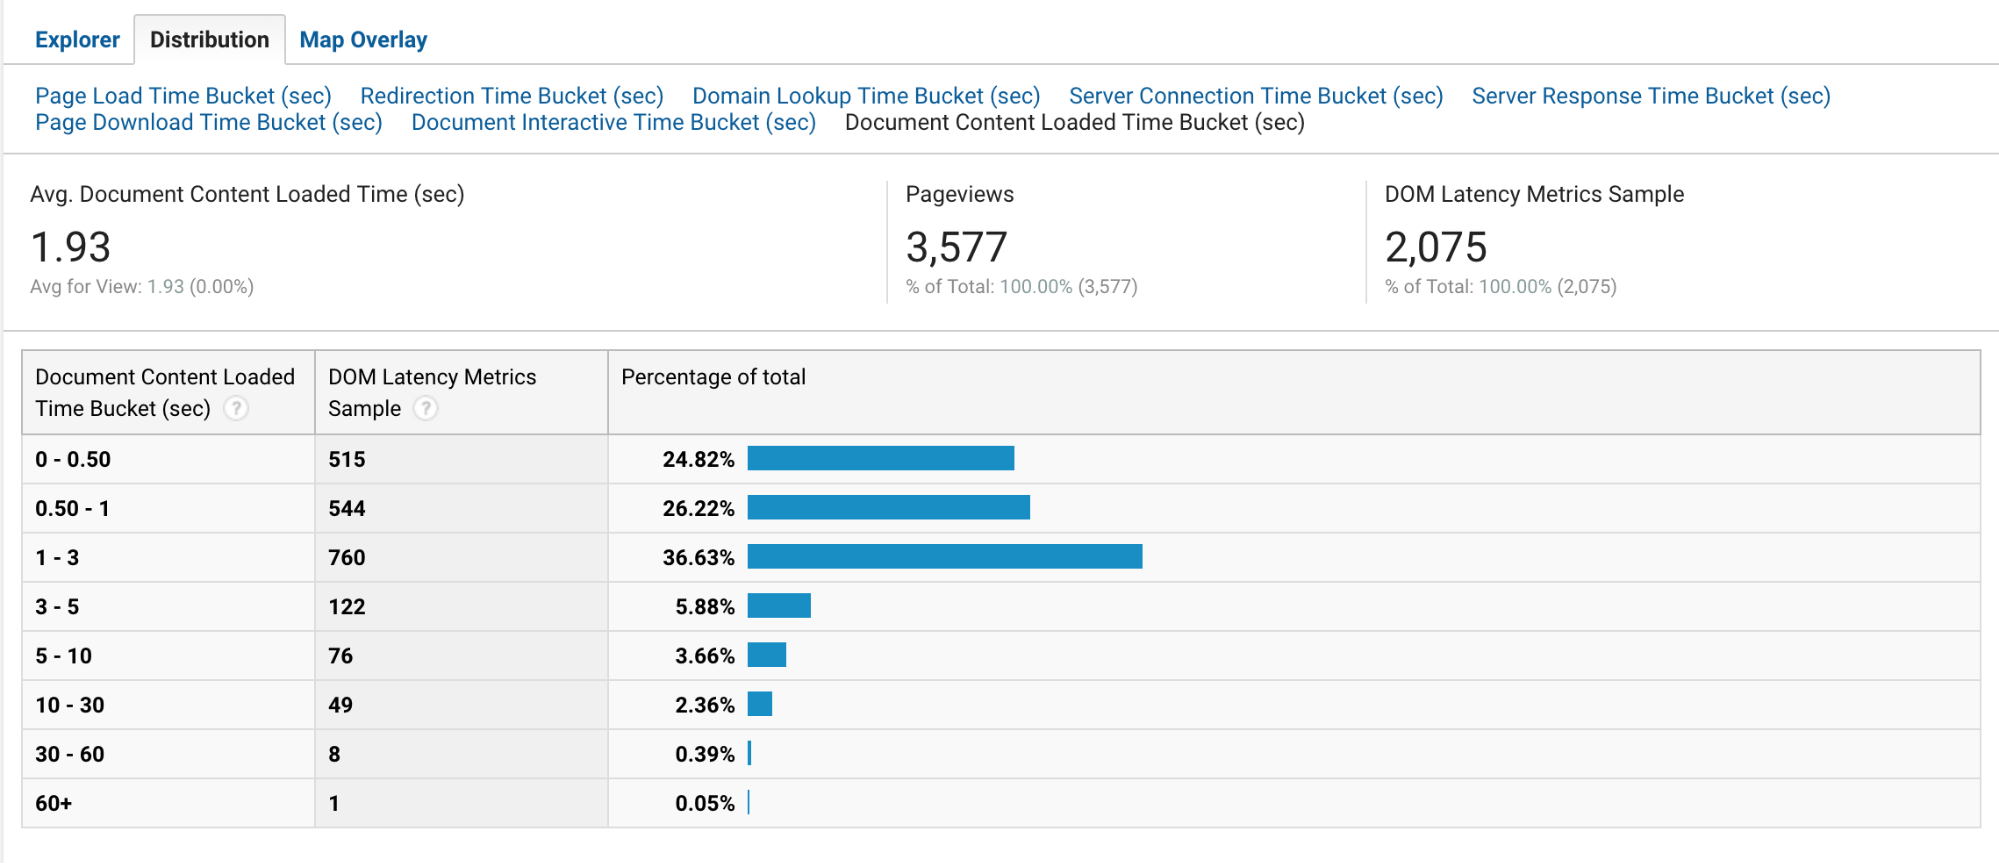
It is preferable to analyze the critical rendering path by looking at the Avg. Document Content Loaded Time and Avg. Document Interactive Time .
2. Beware of sampling raw measurements

Google Analytics measures by default only 1% of the page views tracked on your site . You have the possibility to increase this number. This default sampling rate can be increased up to 10,000 measurements per day. You must therefore calculate your sampling ratio to measure data throughout the day.
The possibility of increasing this number is done at the tracking code level:
[pastacode lang= »javascript » manual= »ga(‘create’%2C%20’UA-XXXX-Y’%2C%20%7B’cookieDomain’%3A%20’domain.com’%2C%20’siteSpeedSampleRate’%3A%20100%7D)%3B » message= » » highlight= » » provider= »manual »/]
So, if you have less than 10,000 page views per day, you can set your ratio to 100%. On the other hand, if you have 100,000 page views per day, we recommend setting your ratio to 10%. This will allow you to measure data over a longer period of time during the day, rather than only measuring it in the first few hours of the day.
These volume limitations are a point on which we really invite you to pay close attention. They can prevent a truly interesting use of Google Analytics. We will see later how to segment your users to conduct an even more detailed webperf analysis. Be careful, however, the size of the segment must remain large enough not to be totally volatile!
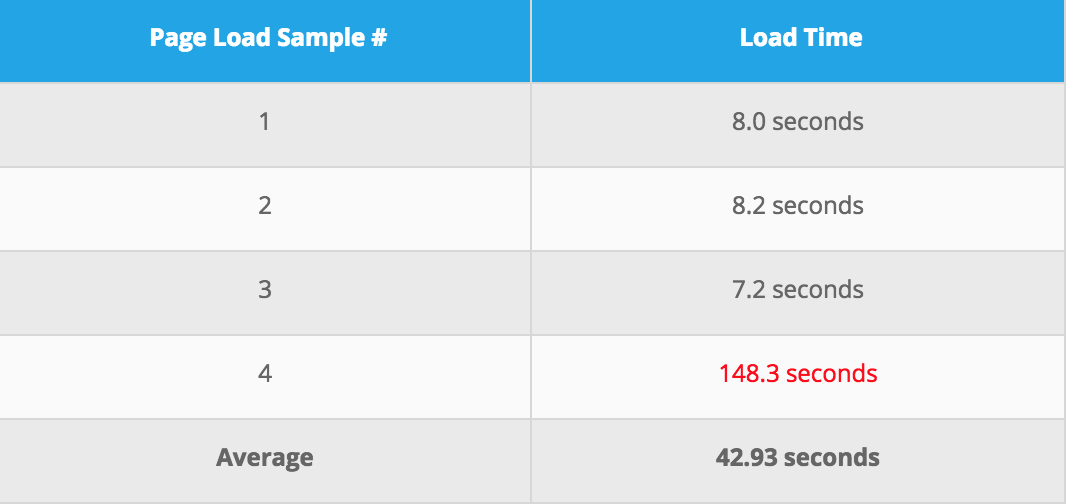
3. Focus on distributions rather than averages
The Google Analytics interface displays by default the averages of the measured metrics. However, these can be strongly influenced by extreme and minority values, unlike the median? As such, the median is therefore more representative of the reality of Internet users. You can also study the 80, 90 and 95 percentiles (the median is the 50th percentile).
To bypass this default displayed average, you can look directly at the distribution curve in the distribution tab .
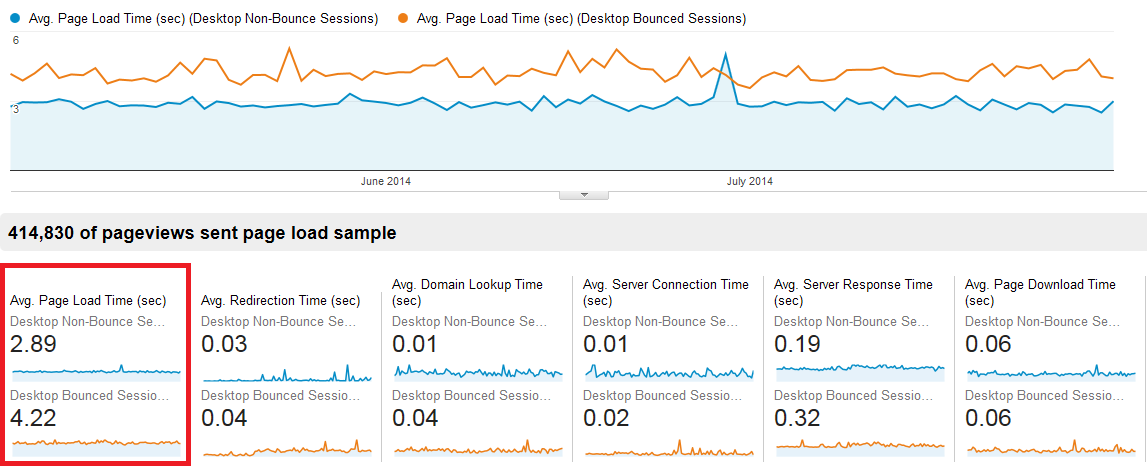
4. Segment your data to better analyze it
Analyzing the loading time of your pages involves segmenting the data to determine the areas of improvement.
We recommend segmenting your data according to the following variables:
- Visitors’ country:
This first filter will allow you to only look at visits from countries that are of interest to your business. This will allow you to eliminate outliers for your macro analysis (bots coming from other countries at strange times, for example).

- Device type:
The measurement differences between desktop and mobile are significant and tend to be visible across all the sites we track. This can easily be explained by the power of phones as well as the difference between mobile and ADSL or fiber. That’s why it’s best to analyze them in different segments.

- Page type or other custom dimension :
We also recommend that you take advantage of your tagging plan to analyze the loading time of your pages by page type. For an e-commerce site, we distinguish at least the home page, the category / product list pages and the product pages.
5. Le tracking des User-Timing
Measuring only Navigation Timing is extremely limiting. Fortunately, Google Analytics also offers the ability to leverage User Timing.
Note however that First Contentful Paint is not completely reliable and is only available on Chrome.
7. How to measure Speed Index
Speed Index is also a very interesting metric that is usually calculated by analyzing the video of the page loading. However, it is possible to calculate an approximate value using Resource Timing.
The most complete script is available here >>
This is also the script used by Fasterize for its own monitoring.
8. Monitor the abandonment rate
We know that users often leave a page before it has fully loaded. Unfortunately, all of our measurements are affected by the [ survivorship bias ] problem, where the data does not include measurements from people who have left the page.
It is still possible to measure the number of abandoned sessions using Google Analytics’ Measurement Protocol . Explanations using the visibilitychange event are described in this article .
Google Analytics can be a good tool for measuring (Real User Monitoring) the performance of your website, thanks to its wide segmentation possibilities, which are difficult to replicate on another tool. However, you must have a sufficiently mature use of it to avoid falling into the various traps: non-significant metrics, strong sampling, average, etc. By integrating your own metrics and cleaning the data via segments, you will be able to draw real conclusions from your figures!
Also remember that this tool does not replace a continuous monitoring tool (RUM) used to alert a team in the event of an anomaly.
Now you are ready to analyze your site’s performance. 


