


📊 Averages for the sector:
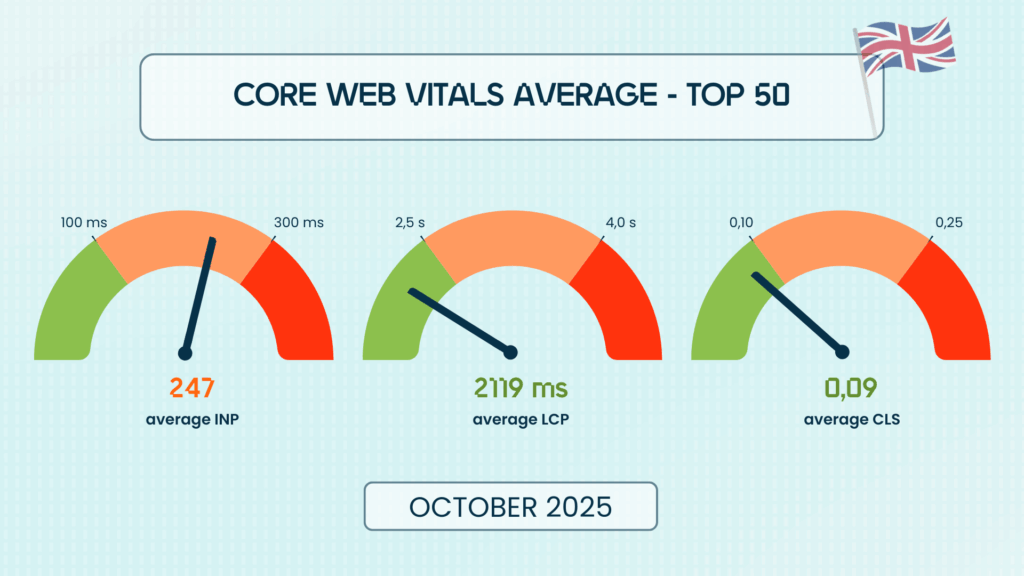
🧪 Core Web Vitals Overview – Top 50 (October 2025)
- ✅ 38% of sites pass all three Core Web Vitals (+10 pts vs August).
- ⏱ 70% meet the LCP benchmark — a stable indicator of fast content delivery.
- 🧭 48% (vs 52% last month) pass the INP threshold — a slight dip, but interactivity remains the key challenge.
- 🔒 76% (vs 72%) now have a green CLS, reducing disruptive layout shifts during browsing.
💡 Takeaway: While the podium remains unchanged, overall progress continues. The gap between the fastest and the rest is narrowing, but maintaining this pace during the holiday traffic surge will be the real test.
Here are the e-commerce rankings, for which web performance is a business and SEO issue.
E-commerce : Webperf ranking of the top 30 most visited sites in the United Kingdom
The race is on for retail performance.
October marks the final stretch before Black Friday and Christmas campaigns — a period where speed and stability directly impact conversion. Some brands clearly used September to optimise; others still have work to do before peak season.
🏆 TOP 3
No shake-up at the very top:
- IKEA (0) – Still untouchable with 1.29 s LCP and a near-perfect 140 ms INP.
- Aldi (0) – Efficient and stable, 1.56 s LCP, 142 ms INP.
- John Lewis (0) – Consistent performance: 1.27 s LCP, 157 ms INP.
🌟 NOTABLE IMPROVEMENTS
Some retailers clearly made good use of August to sharpen user experience:
- Halfords (+3 → #20) – Gains across all metrics (–31 ms INP, –0.04 CLS), though layout stability still needs work.
- Tesco (+3 → #21) – Better interactivity (–80 ms INP), improving shopping flow.
- Pretty Little Thing (+2 → #4) – Keeps climbing after last month’s surge, trimming –15 ms LCP and –19 ms INP, finally pushing INP below 200 ms.
📉 CHALLENGES IN THE RANKINGS
Some big names, however, lost ground:
- Matalan (–2 → #16) – Slight slowdowns (+36 ms LCP, +41 ms INP) that risk lowering conversion.
- Apple (–5 → #25) – Regression across all fronts (+376 ms LCP, +14 ms INP, +0.01 CLS).
📊 Averages for the sector:
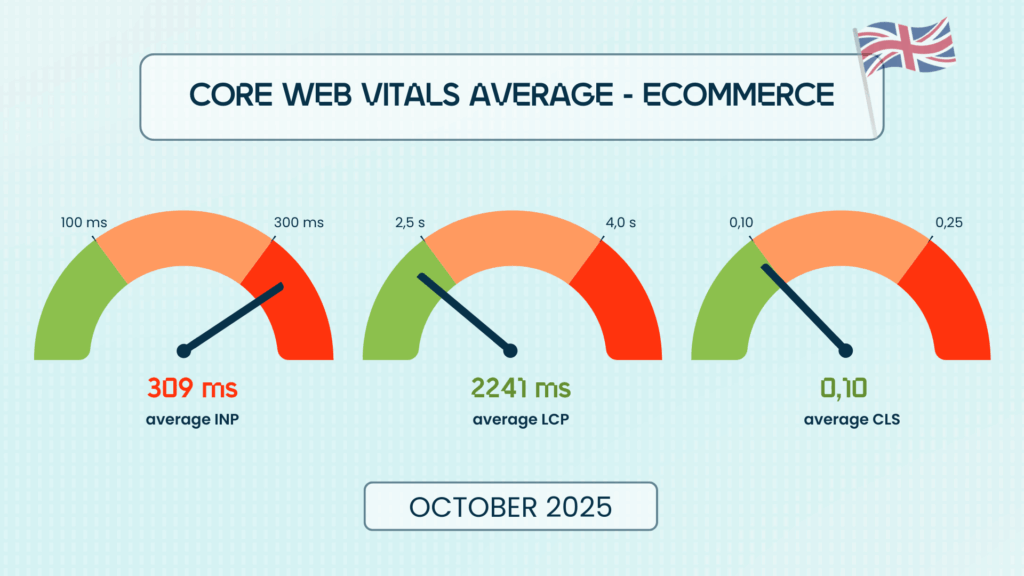
🧪 Core Web Vitals Overview – E-commerce (October 2025)
Performance remains mostly stable, with modest gains in stability but still too few sites meeting all benchmarks.
- ✅ 29% of e-commerce sites pass all 3 Core Web Vitals.
- ⏱ 70% have a green LCP, meaning main content loads fast for most users.
- 🧭 32% meet the INP benchmark: showing progress on interactivity thanks to recent optimisations.
- 🔒 70% display a green CLS, ensuring stable shopping and checkout experiences.
💡 Takeaway: The e-commerce sector is entering the holiday rush with solid loading speeds but still lacks fluid interactivity. Sites that optimise INP now could see the biggest gains during peak sales.
Media : Webperf ranking of the top 30 most visited sites in the United Kingdom
Autumn marks a crucial time for media websites: audiences are back from holidays, news cycles are intensifying, and readers expect instant access and seamless navigation.
This month, stability at the top meets strong comebacks lower down: proof that newsroom performance teams are still pushing hard before the end-of-year rush.
🏆 TOP 3 LEADERS
- The Guardian (0) – Continues to lead with near-perfect balance: 894 ms LCP, 117 ms INP, and stable CLS at 0.05.
- BBC (0) – Holds second with exceptional consistency, combining lightning-fast rendering (873 ms LCP) and flawless stability.
- Sky Sports (0) – Delivers impressive speed (125 ms INP), keeping sports fans engaged in real time.
Several outlets made measurable progress this month, a welcome sign as traffic ramps up:
- Sporting Life (+7 → #19) – Strongest rise of the month, cutting –305 ms on LCP (now green) and improving interactivity.
- Racing Post (+5 → #7) – Enhanced both loading and interactivity (–77 ms LCP, –13 ms INP).
- GB News (+5 → #11) – One of the best optimisations overall: –566 ms LCP, –33 ms INP, significantly boosting perceived speed.
- Hello Magazine (+3 → #10) –118 ms LCP, improving above-the-fold content rendering.
- London South East (+3 → #14) – Better visual stability (–0.03 CLS, now green) and faster loading.
- Good Read (+3 → #21) – Minor LCP optimisation (–12 ms), continuous progress counts.
- News Now (+3 → #22) – Small but positive step forward (–6 ms INP).
📉 CHALLENGES IN THE RANKINGS
Some publishers suffered visible slowdowns, mainly on loading and interactivity, two key drivers of engagement:
- The Sun (–8 → #16) – Heavy degradation (+373 ms LCP, +62 ms INP) at a critical moment for ad revenue.
- The Scottish Sun (–9 → #18) – Similar slowdown across all metrics (+403 ms LCP, +63 ms INP).
- Daily Record (–5 → #25) – INP worsened (+80 ms) and CLS rose (+0.03, now orange).
- Manchester Evening News (–4 → #26) – Overall degradation (+15 ms LCP, +69 ms INP, +0.02 CLS).
- Wales Online (–3 → #24) – +81 ms INP and a CLS drift to orange, smooth reading experience at risk.
📊 Averages for the sector:
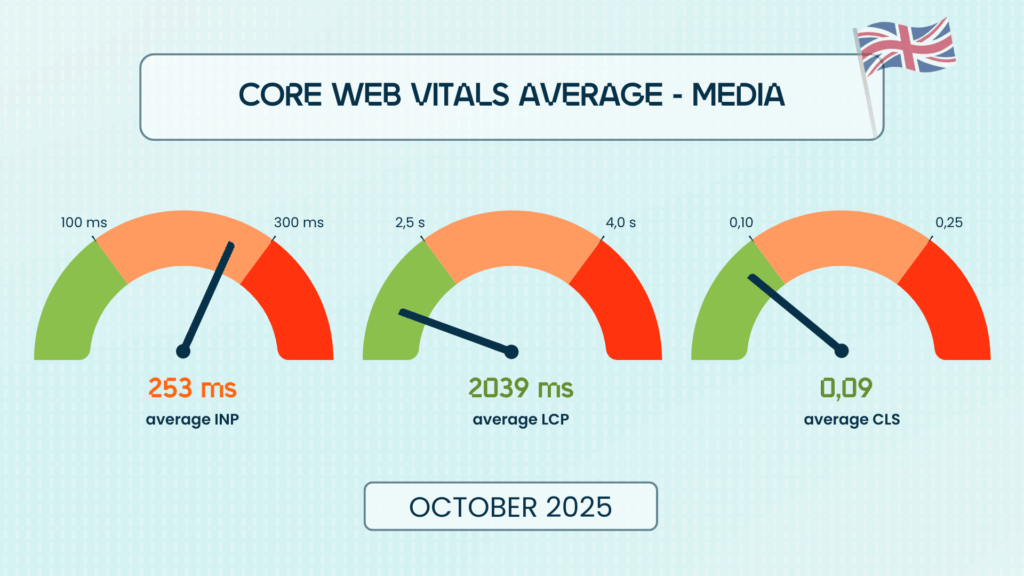
🧪 Core Web Vitals Overview – Media (October 2025)
- ❌ 33% of UK media sites meet all three Core Web Vitals , even seasoned publishers continue to struggle.
- ⏱ 87% deliver fast loading (LCP in the green), readers access stories almost instantly.
- 🧭 36% meet the INP benchmark, confirming that sluggish interactivity remains the weak link for the sector.
- 🔒 70% (down from 77%) maintain a stable layout (CLS green), a worrying dip that could affect reader comfort.
💡 Takeaway: Media sites are keeping pace on speed but losing ground on stability and responsiveness, critical factors as audiences expect frictionless reading experiences across devices and channels.
Travel : Webperf ranking of the top 30 most visited sites in the United Kingdom
As the holiday season approaches, travel websites face mounting pressure. Users expect fast, seamless experiences when booking flights, trains, and hotels, especially as they start planning end-of-year getaways.
After several months of slow progress, this sector shows modest improvement, but it remains the slowest performer across all industries.
🏆 TOP 3 LEADERS
- Transport for London (+1 → #1) – Reclaims the top spot with an excellent 115 ms INP and solid overall consistency.
- Love Holidays (–1 → #2) – Slightly improves its LCP (–19 ms) but loses first place due to a higher INP.
- Pitchup (0 → #3) – Maintains its position with stable results, though its 225 ms INP still leaves room for improvement.
🌟 NOTABLE IMPROVEMENTS
Several travel players used October to optimise before peak booking season:
- Uber (+3 → #12) – Strong comeback with –233 ms LCP, improving time-to-content significantly.
- EasyJet (+3 → #23) – One of the best improvements this month, achieving a triple optimisation:–92 ms LCP, –44 ms INP, and –0.09 CLS — smoother, faster, and more stable pages.
📉 CHALLENGES IN THE RANKINGS
No major regressions this month, though several sites lost two places due to smaller improvements elsewhere. The trend remains positive overall, but consistency will be critical heading into the high-traffic winter months.
📊 Averages for the sector:
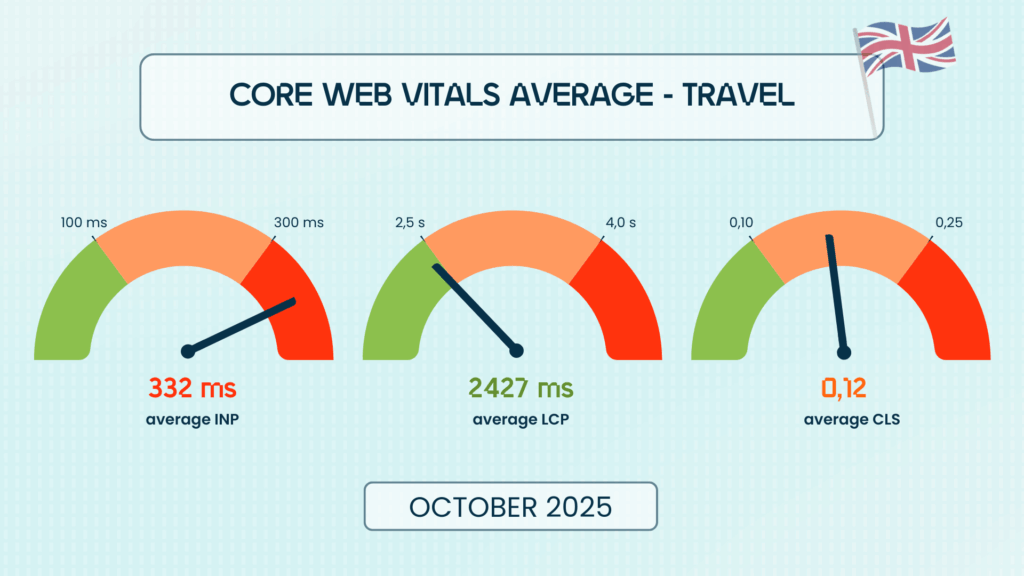
🧪 Core Web Vitals Overview – Travel (October 2025)
Despite some progress, travel remains the lowest-performing vertical in the UK Speed Ranking.
- ✅ 15% of travel sites now pass all three Core Web Vitals (up from 11%).
- ⏱ 52% meet the LCP benchmark, nearly half of sites still load too slowly.
- 🧭 30% (vs 22%) reach a green INP, showing early signs of progress in interactivity.
- 🔒 52% (vs 48%) achieve a green CLS, slightly reducing layout instability.
💡 Takeaway: While the sector is finally showing movement, travel brands still have work to do. In such a competitive, conversion-driven market, even minor lags in booking flow or content rendering can mean lost revenue, especially in the weeks leading up to Black Friday and Christmas travel spikes.
In such a competitive market, standing out through your website’s performance is essential. Fast loading times not only improve user experience but also increase conversion rates and generate more revenue. This monthly ranking is a valuable tool to measure and enhance your site’s performance, allowing you to position yourself against competitors and identify areas for improvement.
We encourage all UK e-commerce leaders to invest in optimizing their site speed and to explore how tools and services like those we offer at Fasterize can help unlock faster, smoother, and more profitable digital experiences to stay competitive. Stay tuned for the next edition to see how your competitors evolve — or how you can overtake them.


")

