


Il y a deux méthodes pour mesurer la webperf : le Synthetic Monitoring (qui sert pour les données Lab data dans les outils Google) et le Real User Monitoring (qui sert pour les données Field data dans les outils Google). Souvent opposées, elles ont pourtant l’avantage de se compléter.
Dans cet article, nous faisons le point sur ces deux méthodes de monitoring de la web performance. De quoi s’agit-il ? À quoi servent-elles ? Comment les utiliser de façon efficace ? Que faut-il savoir pour bien les exploiter ?
Le Synthetic Monitoring (ou Active monitoring)
Les tests sont exécutés :
- sur des serveurs depuis des datacenters
- utilisant une connexion bridée
- pour simuler les conditions qu’un utilisateur moyen peut rencontrer dans les conditions définies pour le test.
Les pages sont réellement chargées par un navigateur, afin de collecter des données de performance correspondant à la réalité de l’expérience utilisateur selon les paramètres configurés pour le test :
- Navigateur
- Type d’appareil (mobile ou desktop)
- Modèle d’appareil
- Zone géographique
- Qualité de réseau…
Les avantages du Synthetic Monitoring
- Contrôle des conditions de test
- Possibilité de tester plusieurs fois un même scénario et de comparer les résultats avant / après optimisation
- Identification des problèmes rencontrés par une catégorie d’utilisateurs (dans certaines zones géographiques, sur certains types d’appareils ou navigateurs…)
Exemples d’outils qui permettent de faire du Synthetic Monitoring
Les données collectées grâce au Synthetic Monitoring
Le waterfall
C‘est une représentation graphique qui prend généralement la forme d’une cascade, et qui permet de visualiser le chargement des différents éléments qui composent une page. Ce graphique est particulièrement intéressant pour identifier les éléments bloquants pendant le chargement (images, scripts, feuilles de style, fonts…).
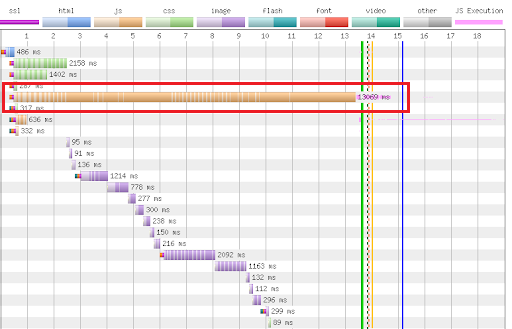 Warterfall WebPageTest montrant une ressource qui ralentit fortement le chargement de la page,
entourée en rouge
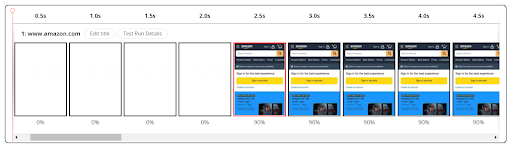
Le filmstrip
Présenté sous la forme d’une série de frames (ou écrans) sur une frise chronologique, il sert à visualiser ce que l’internaute voit à chaque étape du chargement d’une page, et comment elle se compose dans le navigateur.
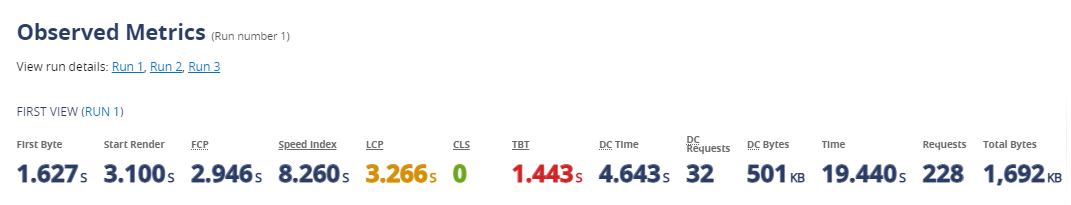
Les données techniques
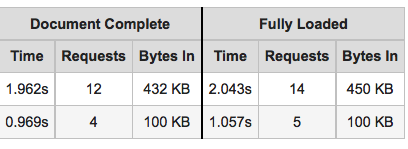
Le nombre de requêtes, le poids de la page, le temps de réponse serveur (Time To First Byte)…
Les métriques liées à l’affichage et au rendu de la page
… et plus généralement à l’expérience utilisateur : Speed Index, Start Render, les Core Web Vitals Cumulative Layout Shift, Largest Contentful Paint…
Quand utiliser le Synthetic Monitoring ?
Pour un benchmark technique
Le Synthetic Monitoring peut servir à évaluer ses propres performances dans un contexte de navigation donné, et les comparer avec celles du marché ou à ses concurrents. Par exemple, il permet de répondre à la question : “mon site est-il plus ou moins rapide que celui de mon concurrent principal en France, en 4G sur un mobile moyen de gamme… ?”.
Pour suivre un budget performance
Le Budget performance. consiste à définir des scores à atteindre et / ou des seuils à ne pas dépasser, par exemple : un score PageSpeed de 90 minimum, diviser le Speed Index par 10, limiter le poids des pages à 1Mo…
Prendre des mesures à intervalles réguliers dans des conditions identiques permet d’évaluer les progressions et les régressions, et de mesurer l’impact des optimisations déployées.
Pour identifier un SPOF (Single Point Of Failure)
Les outils de Synthetic Monitoring permettent d’identifier précisément les lenteurs, notamment grâce aux fonctionnalités de visualisation, pour repérer les ressources qui peuvent poser problème pendant le chargement des pages et dégrader l’expérience utilisateur (cf. le waterfall WebPageTest plus haut).
Le Real User Monitoring (ou Passive monitoring)
Les données RUM sont collectées en continu, et non à un instant T comme avec le Synthetic Monitoring, grâce à un script qui mesure les temps de chargement.
Les avantages du Real User Monitoring
- Analyse du trafic du site et prise en compte des actions des utilisateurs réels
- Mesure continue
- Prise en compte de tous les utilisateurs, toutes conditions de navigation et zones géographiques confondues (pas de conditions à définir avant de lancer un test)
Exemples d’outils qui permettent de faire du Real User Monitoring
Les données collectées grâce au Real User Monitoring
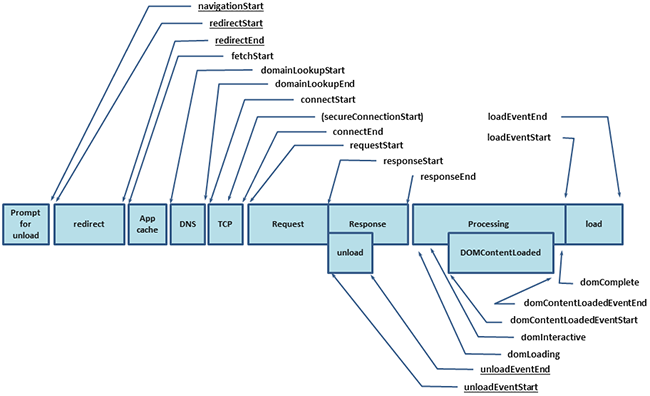
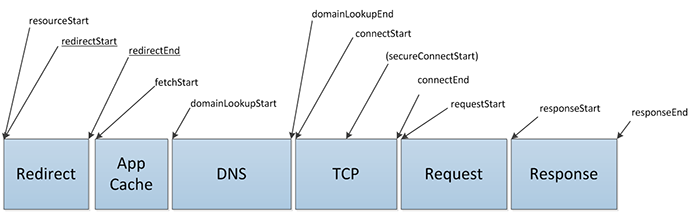
Navigation Timing : les outils de RUM tirent profit de l’API Navigation Timing. Voici l’ensemble des données disponibles au fur et à mesure du chargement d’une page :
- Resource Timing : cette API permet de mesurer de façon détaillée les temps de chargement de chaque ressource statique.
- User Timing : l’API User Timing permet de marquer et mesurer des événements spécifiques dans le navigateur.
- Les taux de conversion et autres données business : certains outils de RUM permettent de corréler temps de chargement et taux de conversion. C’est possible avec Google Analytics, ou encore Quanta.
En résumé, le Synthetic Monitoring permet entre autres de suivre l’évolution de vos performances dans le temps et de vous positionner par rapport à vos concurrents, tandis que le RUM permet d’observer l’expérience de vos clients sur le terrain.
Comme nous l’avons dit en introduction, ces méthodes sont complémentaires.
A noter : étant donné que la méthode de collecte est différente, les résultats le sont aussi ! Voici quelques conseils pour pouvoir interpréter correctement les données.
Monitoring webperf : ce qu’il faut savoir pour comprendre les résultats
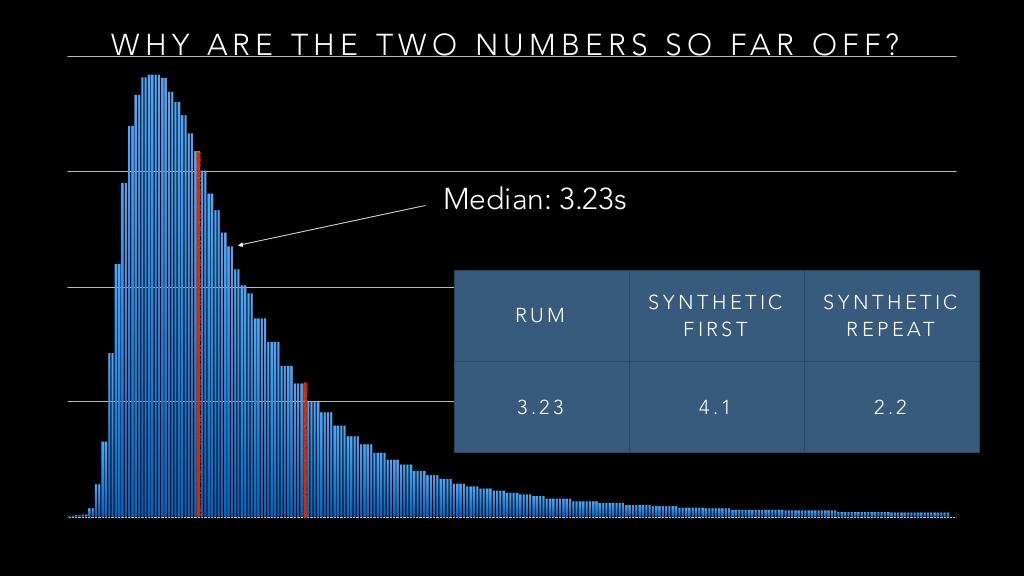
Entre Synthetic et Real User Monitoring, les résultats sont difficilement comparables, d’autant qu’ils peuvent être très éloignés. Pourquoi ?
Outre les conditions de collecte des données, cela tient aussi au fait que les outils de RUM combinent les données de first view et repeat view dans des contextes très différents, car le parc d’utilisateurs réels peut être fortement hétérogène.
Autrement dit, les métriques sont issues d’un mélange entre celles relevées sur des pages vues pour la première fois, et celles relevées sur des pages lors d’une revisite avec des données venant d’un cache (et donc potentiellement plus rapides).
Au contraire, sur un outil de Synthetic Monitoring, les mesures sont généralement faites sur une first view dans un contexte unique et homogène.
En conséquence, comme le montre ce graphique, les temps de chargement indiqués pour une même page peuvent être différents :
Vous devez donc choisir les données et le contexte de collecte en fonction de ce que vous voulez illustrer. En effet, la vitesse de chargement ne peut pas se résumer en un seul chiffre !
Chaque KPI a son intérêt, et l’avantage de cette pluralité est de pouvoir parler à tous les métiers : les équipes E-commerce seront sensibles aux gains business, tandis que les équipes SEO pourront fixer des objectifs pour optimiser les Core Web Vitals et le score PageSpeed ; quant aux équipes techniques, elles pourront se concentrer sur les métriques à améliorer pour soulager l’infra.
Chacun à son niveau a ses propres références et exigences, et pour un site performant, toutes les équipes ont un rôle à jouer.
Quelles sont les métriques à suivre et à améliorer ?
Découvrez les KPI webperf essentiels à connaître :


