


(article updated 12/03/15)
“How do I evaluate the results of an A/B test via Google Universal Analytics?”
Not long ago, a customer asked us this question. Then we realized that many of you were asking it.
Conducting an A/B test to evaluate a service is all well and good. Being able to feed the information back into Google Analytics or Universal Analytics is even better. So here’s a tutorial on how to retrieve the results of your A/B test directly in your Google Analytics or Universal Analytics account.
First of all, you should know that, generally speaking, to retrieve the data from an A/B test (of any kind) in your Google Analytics, you need to modify the tag directly in the code of your site. (The easiest way to do this is to use the site developer or a Tag Manager-type tool).
But good news! If you’re using Fasterize, you can skip this step, as we’ve already integrated the tag automatically! All that’s left is for you to quietly pull up the information in Google Analytics. Here’s how to do it:
1. Check which version of Google Analytics you’re using
Are you using Google Analytics or Universal Analytics?
Now that you have the answer to this first question, you have two options:
- are you using Google Analytics? Click here “A/B testing on Google Analytics (for the old tag)“.
- are you using Universal Analytics? Then stay here and enjoy your reading 🙂
2. Create the custom dimension
-
- log in to your Google Analytics account and click on admin (in the top menu), then in the middle column (property), choose “Custom dimensions”.
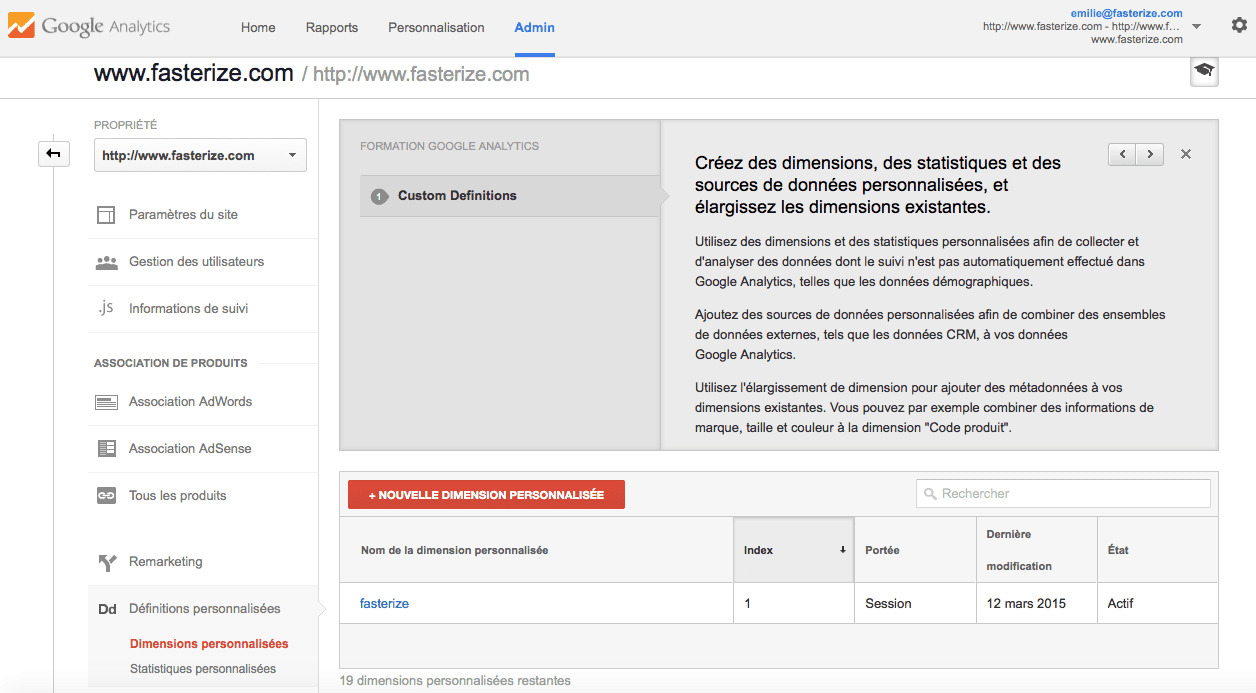
-
- click on “new custom dimension” and give your dimension a name (Fasterize for example)
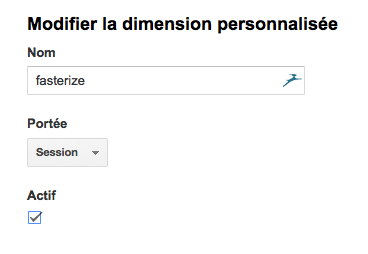
- click on “create”.
Your new dimension is created!
3. Create a segment
We’re going to create two new segments: “Fasterize On” and “Fasterize Off”.
-
- Go back to your dashboard and click on “+ Add segment”.
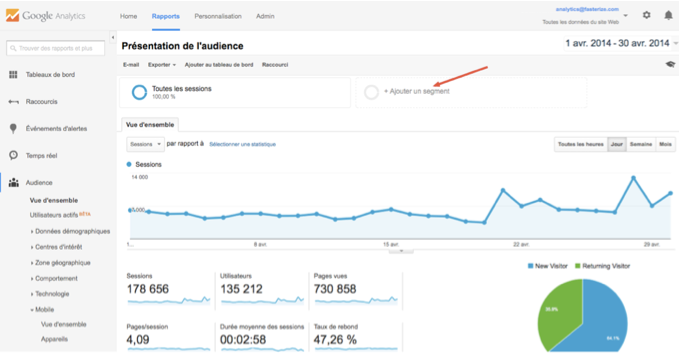
-
- click on “+ new segment
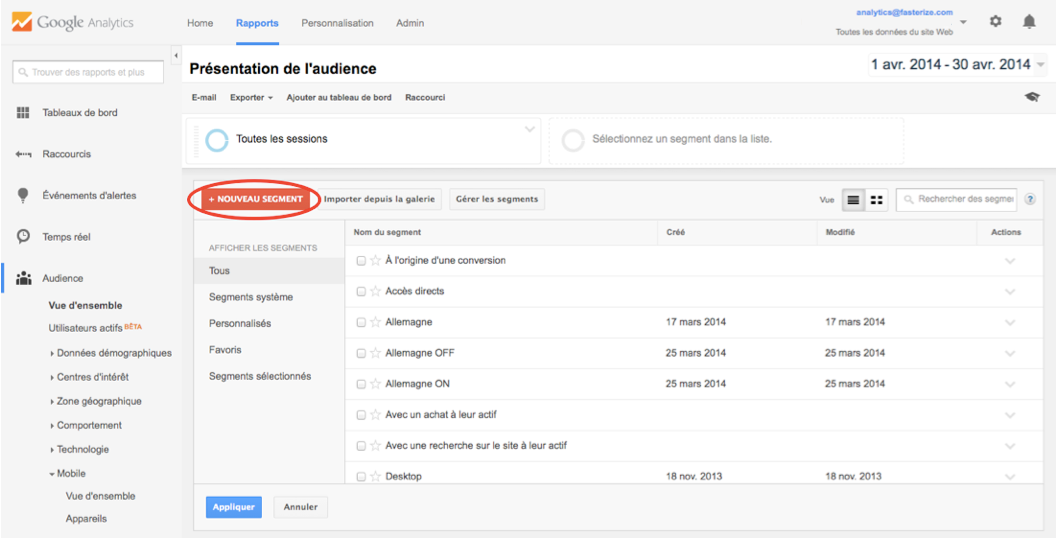
-
- create the Fasterize On filter as follows:
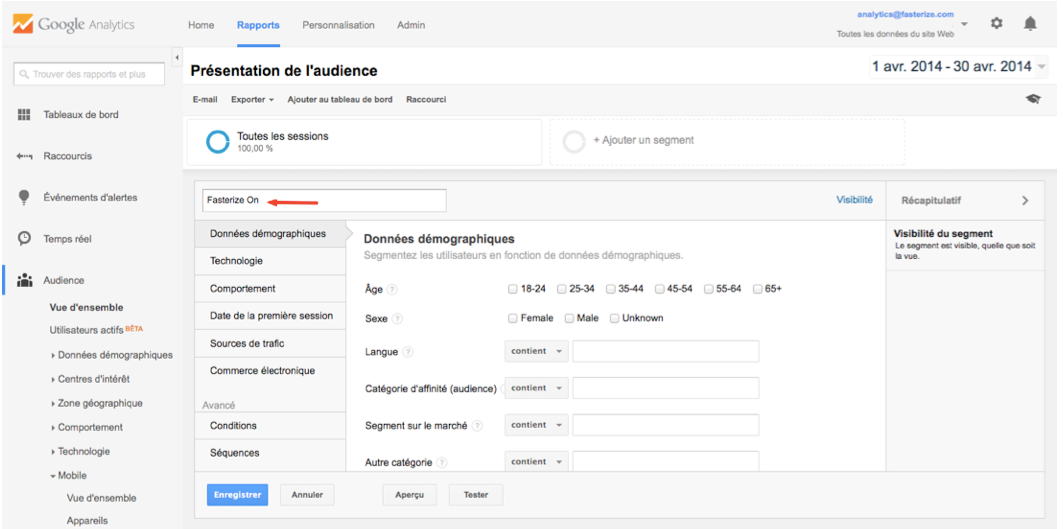
-
- go to Advanced > Conditions
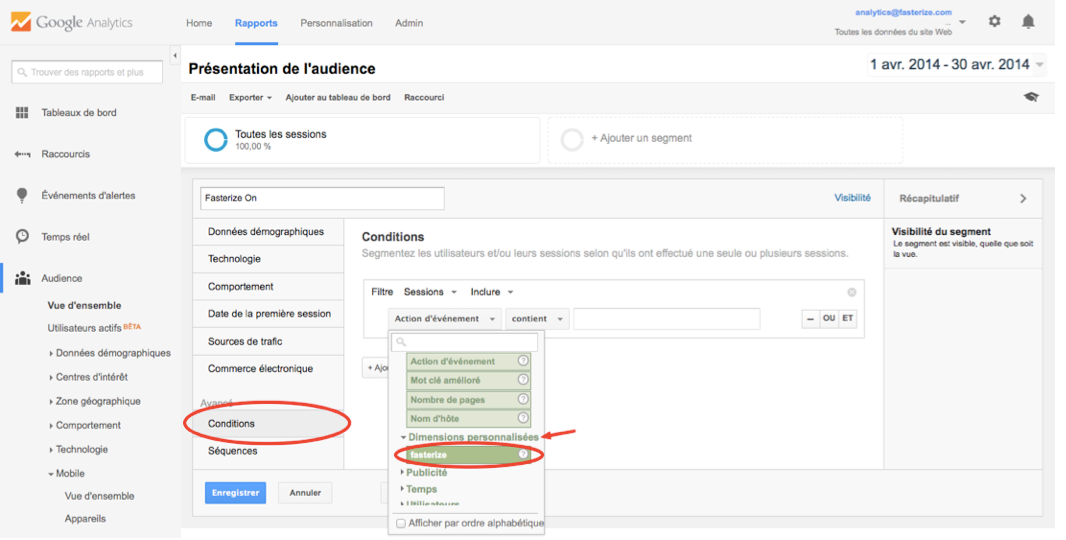
-
- configure the segment by specifying: fasterize (to be chosen in the custom dimension sub-section) contains yes
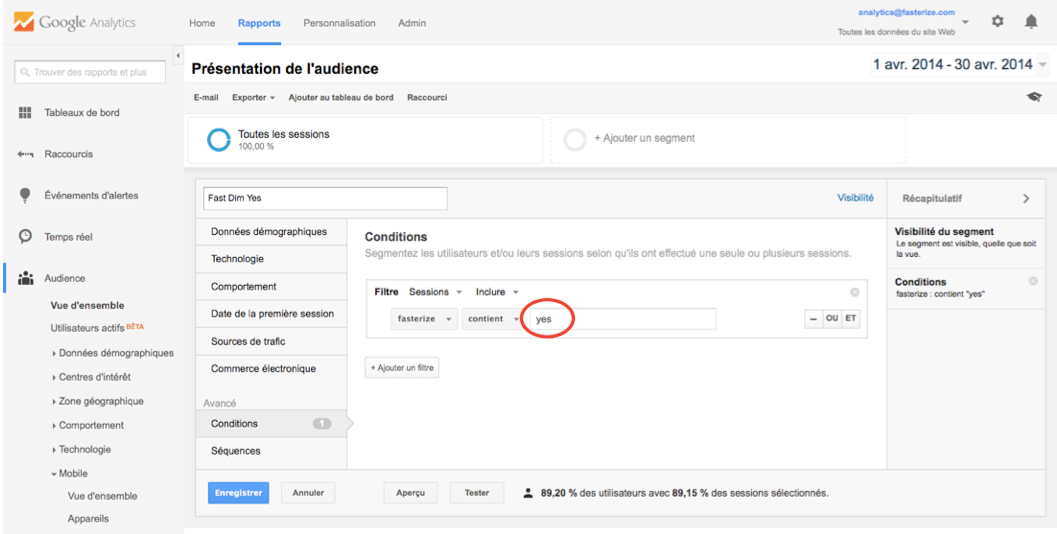
- repeat the operation, creating the Fasterize off segment (fasterize contains no)
4. Compare the data by selecting the two filters

And that’s all there is to it. You can analyze all the business metrics you want. And by the way, here’s a sample excel doc for measuring your KPIs.
Don’t hesitate to leave us a comment to tell us what you think of this tutorial, or to ask us any questions you may have!
Want to speed up your site?
Lighten your server load during peak periods?


