

Each row represents a particular resource referenced by your web site (JavaScript files, stylesheets, images, etc.). For each resource, a request is sent to the server and the server sends a response back to the browser.
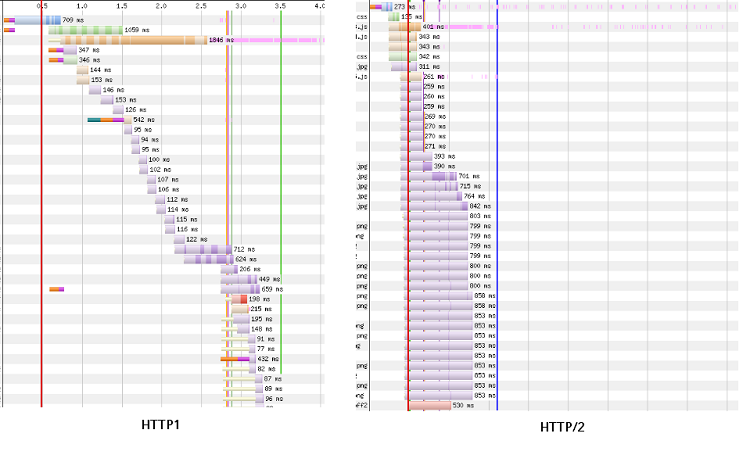
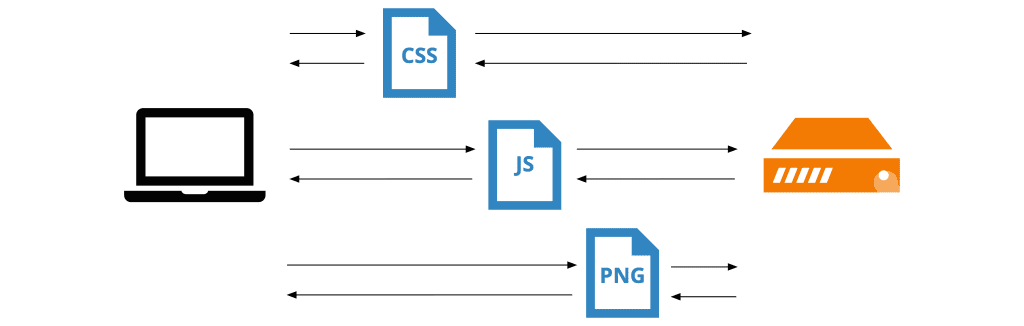
Illustrating the difference between HTTP 1.1 and HTTP/2
HTTP/2 a Web protocol whose specification was approved in May 2015.
It allows files to be transferred over a single connection (also referred to as multiplexing). Requests are then issued concurrently by the browser. There is no need to wait until one request has completed before issuing a subsequent request over that same connection, as was the case in HTTP 1.1.
Have a look here at the differences in a Waterfall between the two potocols:
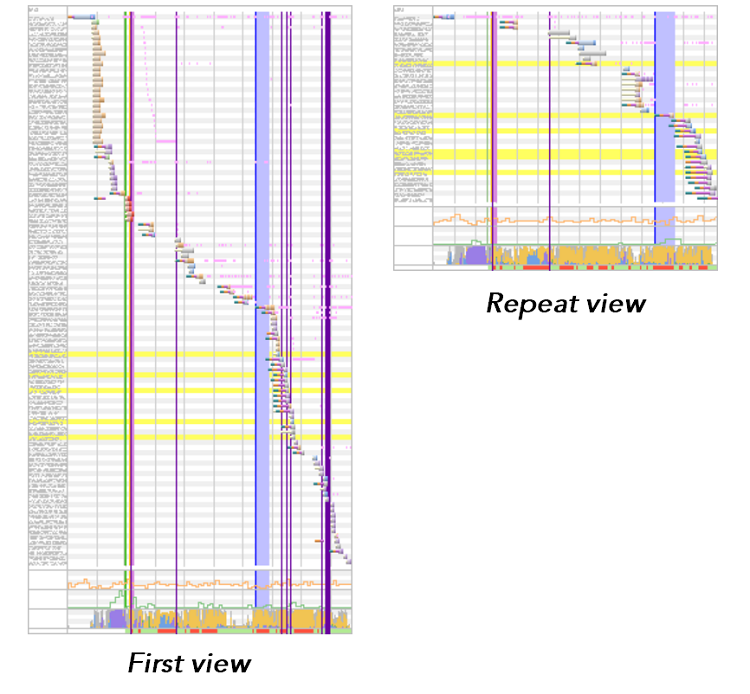
First View vs Repeat View
Also, a Waterfall chart can be different depending on a "First View" timeline (the first time a user goes to your web site) and a "Repeat View" timeline (user returning to your web site).
Understanding a Waterfall chart
Looking a little more closely at a Waterfall, we can deduce a whole host of information about the process of loading a web page.
Reading across the Waterfall chart

- White for wait
The browser discovers the resource and waits for the right moment to download it. - Dark green: DNS resolution
This initial step associates a domain name with its IP address: the browser must determine where to go to retrieve the information. - Orange: TCP connection
TCP (Transport Control Protocol) is the protocol for ensuring communication between the server and the browser. The browser must establish one or more TCP connections with the servers to which it addresses, and this connection can take time. Thus, the more connections there are, the more time the site may need to load. Until now (HTTP / 1.1 protocol) the TCP connection could be a weak point of the performance of a site, but with HTTP / 2, a single TCP connection can be used to send and receive multiple requests HTTP. It is therefore no longer necessary to open several TCP connections. The HTTP / 3 protocol is based on another transport protocol called UDP. - Purple: TLS connection (formerly SSL)
TLS (Transport Layer Security) or formerly SSL (Secure Sockets Layer) allows resources to be sent over a secure connection. The information transmitted thus remains confidential and is not accessible by third parties. In addition, security ensures the integrity and authenticity of the data. - Next come the resource downloads: blue for HTML code, orange for JavaScript files, green for CSS, purple for images, turquoise for flash and red for fonts, with grey for any other resources.
Each of these bars consists of a light and dark section. The light section represents the Time To First Byte for the resource in question, while the dark section represents the actual downloading of the resource. - Pink: JavaScript execution
The longer the execution, the longer the pink bar. Potentially blocking JS are symbolized by long horizontal bars, you should pay attention!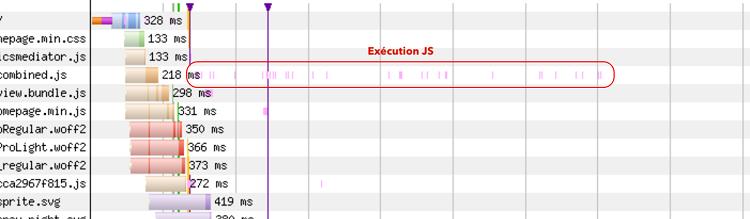
The Time To First Byte (TTFB)
Time To First Byte is the time taken to load the first byte-- or more specifically, the time taken by the server to send the first byte. TTFB is a key factor when it comes to page ranking, as explained by Webrankinfo: “TTFB is extremely important for organic page ranking, as it determines how your web site's HTML is accessed. Specifically, Googlebot search bot allocates each web site a "quota" to each web site that it crawls (almost certainly based on a time limit, or possibly other metrics). If it does manage to visit all of your site within this quota, then hard lines: some of your pages are likely not to be updated or even not indexed at all!”
Several factors can have a negative impact on TTFB. While some of these are factors beyond the web site's control, such as the quality of the user's Internet connection, others can indeed be optimised, e.g. server response times or distance from the server to the user.
Reading down the Waterfall chart
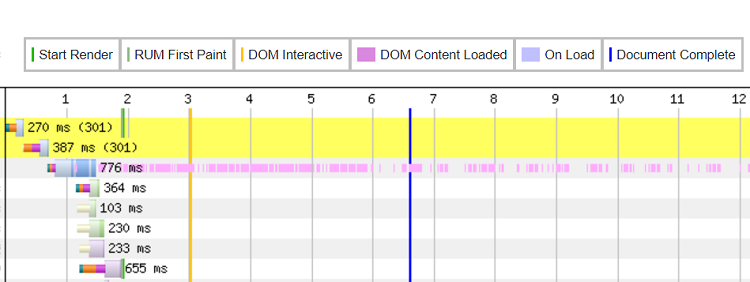
- The green line represents “Start Render”: this shows when the blank page begins to be filled with the first elements of the web page.
- The light green line represents the First Contentful Paint (mentionned as RUM First Paint in the Waterfall)
- The yellow line represents “DOM Interactive”: this shows when the HTML code has finished parsing and the DOM has finished building.
- The purple line represents “DOM Content Loaded”: this shows when the DOM is ready and there are no more stylesheets needed to begin execution of any JavaScript. The page structure can now be built up.
- The blue line represents “Document Complete” (or “Load Time”): this shows when all processing is complete and all resources on the page (images etc) have finished downloading.
This event is fired at the same time as "window.onload()". For a long time it was the de facto web performance indicator, but this is no longer the case. The reason is that load time no longer determines when a web page actually becomes usable. A user may start interacting with the page prior to this event. - “Fully loaded” indicates when all of a web page's resources (including hidden external resources) have loaded.
Keep an eye on your Waterfall
Now you have a better understanding of Waterfall charts, it's time to turn our interest in the number and size of the bars they contain.
Large numbers of orange bars?
This can mean one of two things:
- Too many resources are spread over different domain names, so at least one connection must be established to each of these servers. In this case, the solution then consists in gather as much as possible resources on a single domain name in order to limit the number of TCP connections.
- The requests are sent via different TCP connections, one after the other. In this case, you are surely in HTTP / 1.1 and it is possible to apply the keep-alive which allows to use a single and same TCP connection for several resources. Or better: go to HTTP / 2!
| Without the keep-alive :
| With the keep-alive :
|

(image source: KeyCDN)
Large numbers of requests to load?
Concatenation, image inlining (embedding small images directly within the page HTML) and lazy image loading (only images appearing above the fold are loaded, with the remaining images being loaded as the user begins to scroll the page) will help to mitigate the situation.
Resources taking a long time to load?
Are your JavaScript, CSS, flash, image and font files (etc) slow to load?
Implement key recommended practices for reducing resource sizes: image compression, Gzip / Brotli support, minification of JavaScript/CSS/HTML files.
Slow Time To First Byte?
A CDN should help to solve this issue. For more information about CDNs, do check out “Content Delivery Network: 11 Questions & Answers”.
This brief overview should give you a better understanding of your Waterfall charts. The aim of the game: to shrink the Waterfall both horizontally and vertically!